
Advanced Search for Maps
Showing 1251-1260 of 2217
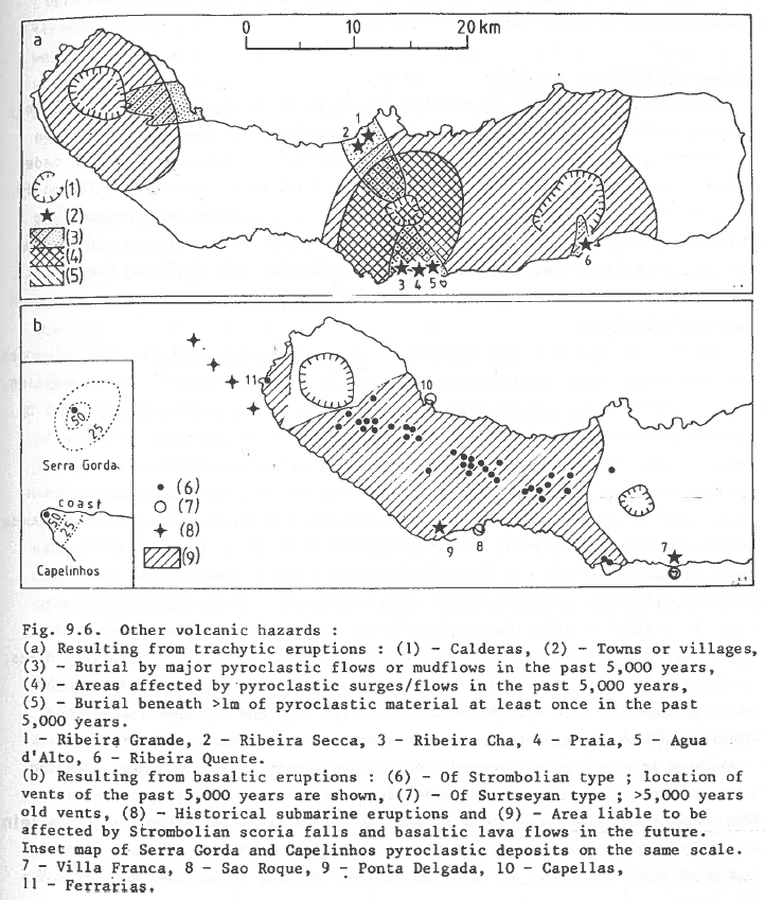
Figure in a journal article
Other volcanic hazards
Figure 9.6 in: Booth, B., Croasdale, R., & Walker, G.L. (1983). Volcanic hazard on Sao Miguel, Azores. In: Tazieff, H. & Sabroux, J.C. (eds.). Forecasting Volcanic Events. Elsevier, Amsterdam. p. 99-109.
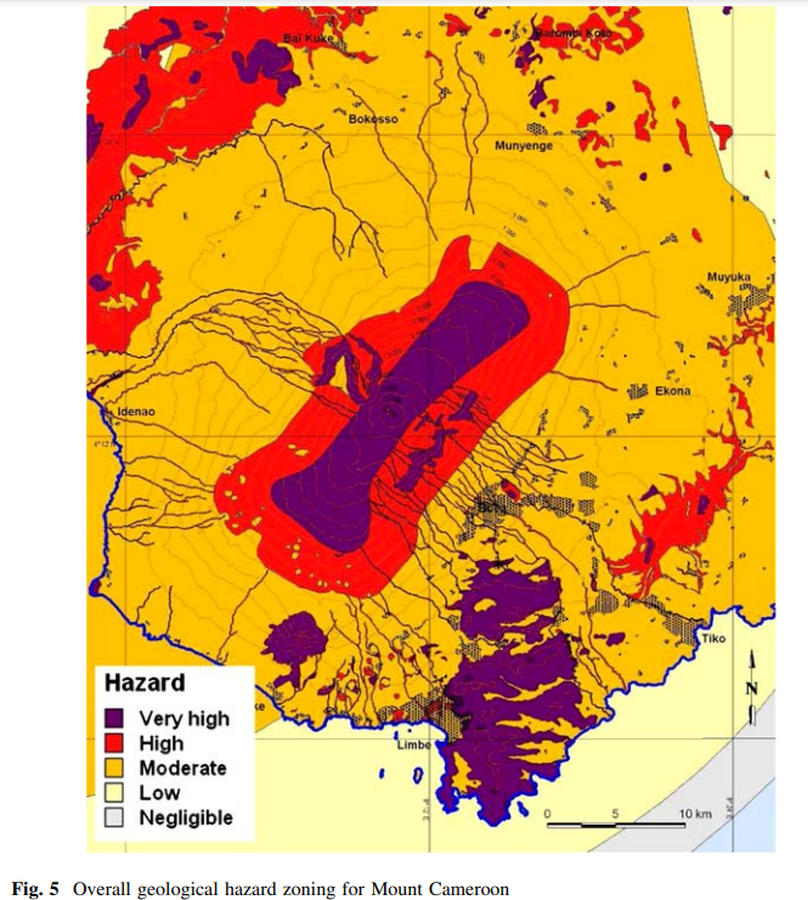
Figure in a journal article
Overall geological hazard zoning for Mount Cameroon
Figure 5 in: Thierry, P., Stieltjes, L., Kouokam, E., Nguéya, P., & Salley, P. M. (2008). Multi-hazard risk mapping and assessment on an active volcano: the GRINP project at Mount Cameroon. Natural Hazards, 45(3), 429-456. https://doi.org/10.1007/s11069-007-9177-3
Official, Figure in hazard assessment
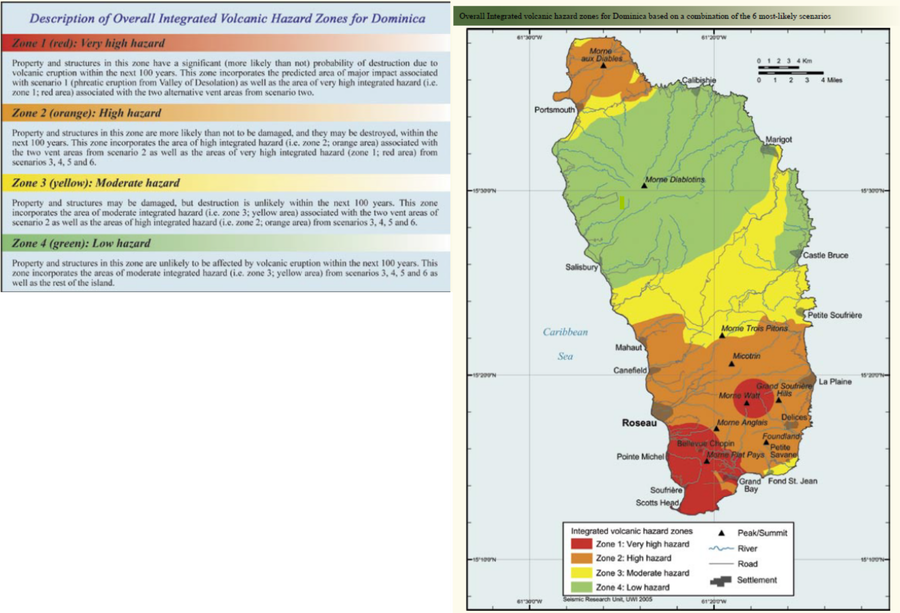
Overall Integrated volcanic hazard zones for Dominica based on a combination of the 6 most-likely scenarios
Page 43 in: Lindsay, J.M., Smith, A.L., Roobol, M.J., & Stasiuk, M.V. (2005). Dominica. Volcanic hazard atlas of the Lesser Antilles. In: Lindsay, J.M., Shepherd, J.B., Robertson, R.E.A., & Ali, S. (Eds) Volcanic hazard atlas of the Lesser Antilles. Seismic Research Unit, The University of the West Indies, Trinidad and Tobago, W.I.
Official, Figure on website
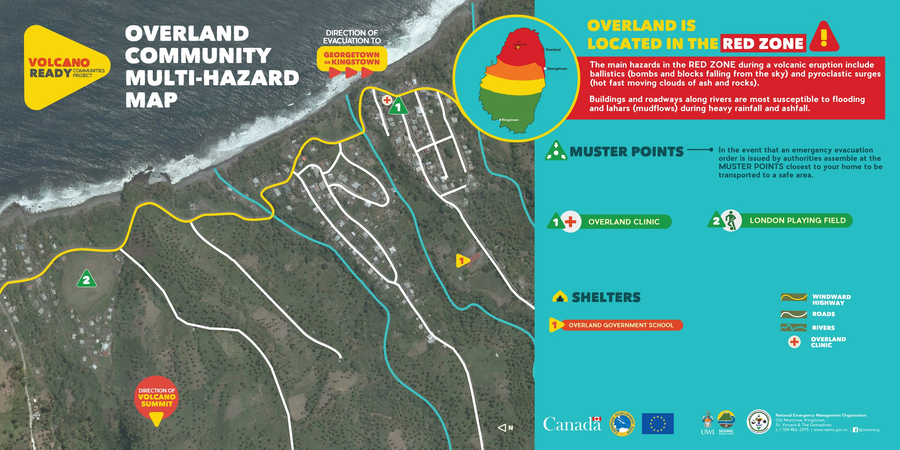
Overland Community Multi-Hazard Map
The University of the West Indies Seismic Research Centre (UWI-SRC) and National Emergency Management Organization (NEMO). (2021). Overland Community Multi-Hazard Map. https://uwiseismic.com/wp-content/uploads/2021/10/Overland-Hazard-Map-scaled.jpg

Figure in a journal article
Overzichtskaart van den Tjerimai
(Overview map of the Tjerimai)
Neumann van Padang, M. (1937). De uitbarsting van den Tjerimai in 1937 (verschijnselen van Juni t/m September). De Ingenieur in Nederlandsch-Indië. Mijnbouw en Geologie. De Mijningenieur. 4 (12), p. 212-228

Official, Figure on website
Owia/Point Community Multi-Hazard Map
The University of the West Indies Seismic Research Centre (UWI-SRC) and National Emergency Management Organization (NEMO). (2021). Owia/Point Community Multi-Hazard Map. https://uwiseismic.com/wp-content/uploads/2021/10/Owia-Point-Hazard-Map-scaled.jpg
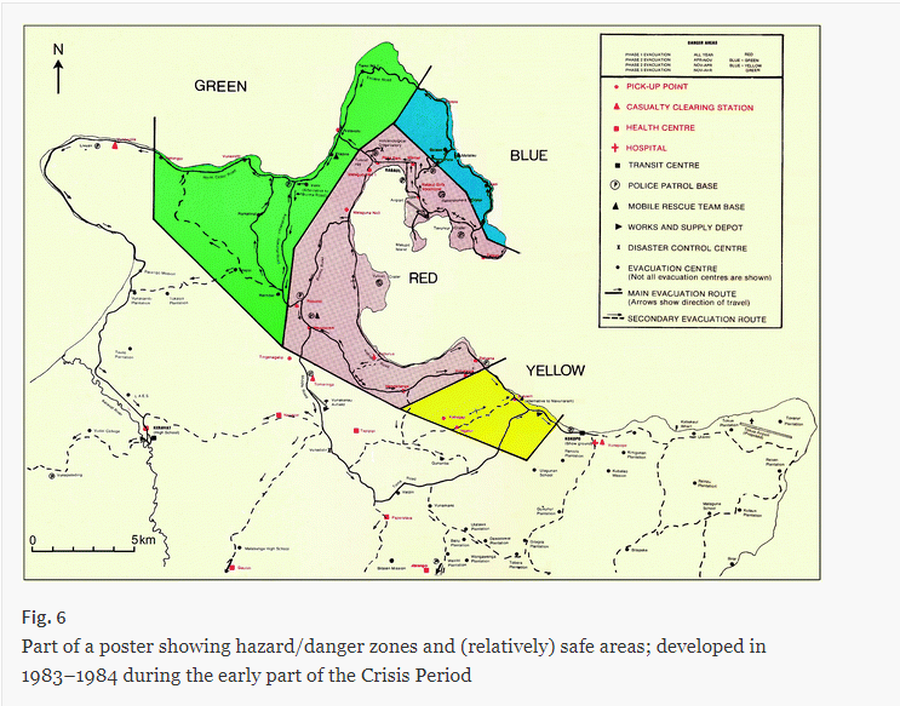
Official, Map sheet or poster
Part of a poster showing hazard/danger zones and (relatively) safe areas; developed in 1983–1984 during the early part of the Crisis Period
Figure 6 (in reprint) in: RVO. (1984). (Reprinted in: McKee C., Itikarai I., & Davies H. (2017). Instrumental Volcano Surveillance and Community Awareness in the Lead-Up to the 1994 Eruptions at Rabaul, Papua New Guinea. In: Fearnley C.J., Bird D.K., Haynes K., McGuire W.J., & Jolly G. (eds) Observing the Volcano World. Advances in Volcanology (An Official Book Series of the International Association of Volcanology and Chemistry of the Earth’s Interior – IAVCEI, Barcelona, Spain). Springer, Cham. https://doi.org/10.1007/11157_2017_4)
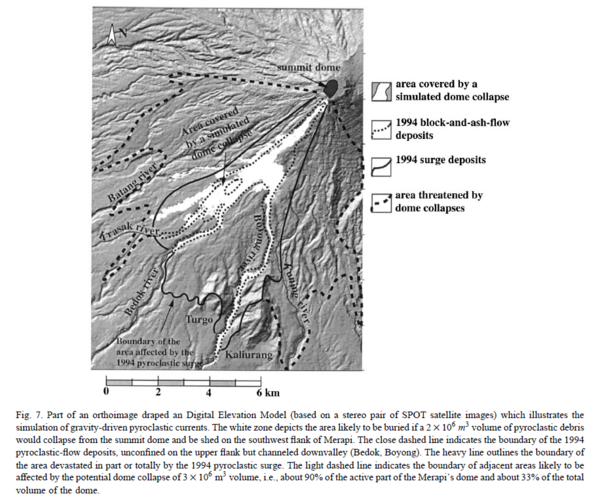
Figure in a journal article
Part of an orthoimage draped Digital Elevation Model which illustrated the simulation of gravity-driven pyroclastic currents.
Figure 7 in: Thouret, J.-C., Lavigne, F., Kelfoun, K., & Bronto, S. (2000). Toward a revised hazard assessment at Merapi volcano, Central Java. Journal of Volcanology and Geothermal Research, 100(1-4), p. 479-502. https://doi.org/10.1016/S0377-0273(00)00152-9
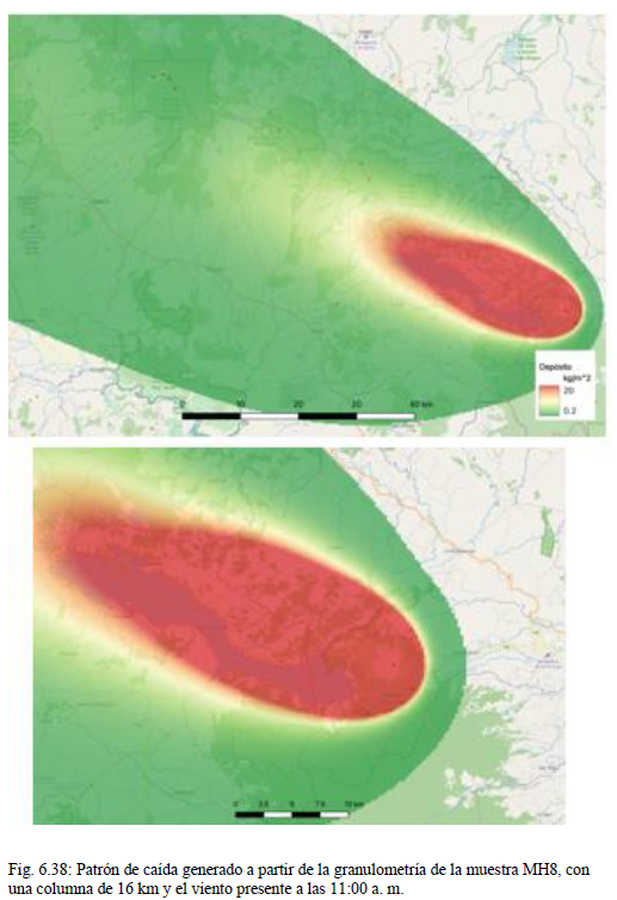
Official, Figure in hazard assessment
Patrón de caída generado a partir de la granulometría de la muestra MH8, con una columna de 16 km y el viento presente a las 11:00 a.m.
(Fall pattern generated from the granulometry of sample MH8, with a 16 km column and the wind present at 11:00 a.m.)
Figure 6.38 in: Alvarado, G.E., Brenes-André, F., Núñez, D., Borbón, J., Ramírez, M.A., Alpízar, Y., Núñez, S., Sibaja, J.P., Esquivel, L. (2023). Actualización del Análisis del Peligro Volcánico del Arenal, Costa Rica. Instituto Costarricense de Electricidad (ICE). Mayo 2023.
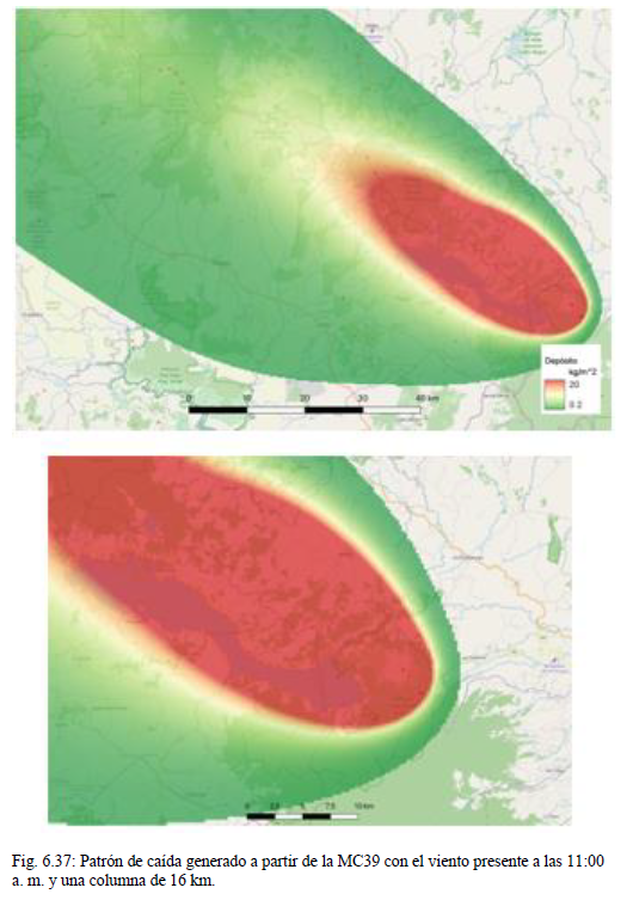
Official, Figure in hazard assessment
Patrón de caída generado a partir de la MC39 con el viento presente a las 11:00 a.m. y una columna de 16 km
(Fall pattern generated from MC39 with the wind present at 11:00 a.m., and a column of 16 km)
Figure 6.37 in: Alvarado, G.E., Brenes-André, F., Núñez, D., Borbón, J., Ramírez, M.A., Alpízar, Y., Núñez, S., Sibaja, J.P., Esquivel, L. (2023). Actualización del Análisis del Peligro Volcánico del Arenal, Costa Rica. Instituto Costarricense de Electricidad (ICE). Mayo 2023.