
Advanced Search for Maps
Showing 1-10 of 2338
Official, Figure in a journal article
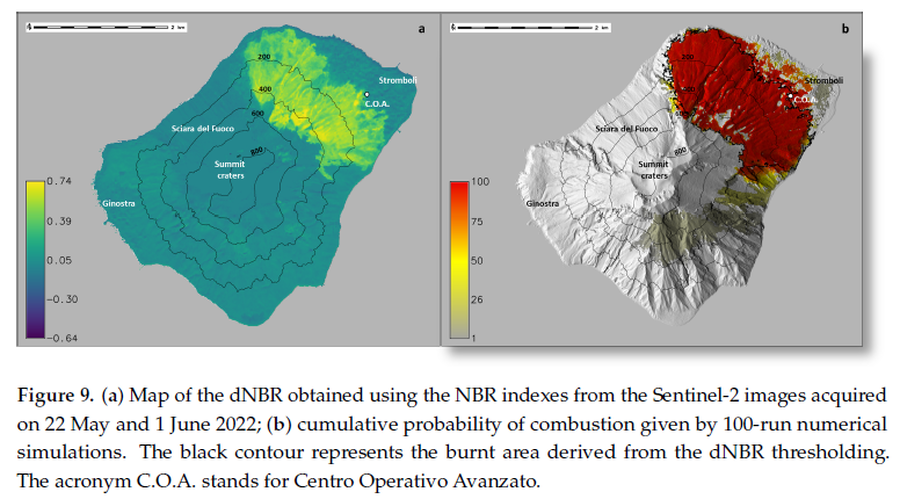
(a) Map of the dNBR obtained using the NBR indexes from the Sentinel-2 images acquired on 22 May and 1 June 2022; (b) cumulative probability of combustion given by 100-run numerical simulations
Figure 9 in: Guardo, R., Bilotta, G., Ganci, G., Zuccarello, F., Andronico, D., & Cappello, A. (2024). Modeling Fire Hazards Induced by Volcanic Eruptions: The Case of Stromboli (Italy). Fire, 7(3), 70.
Official, Figure in a journal article
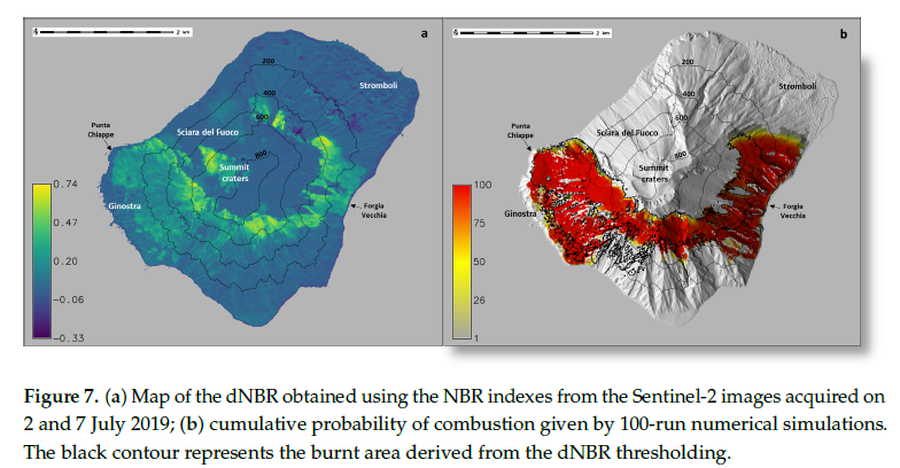
(a) Map of the dNBR obtained using the NBR indexes from the Sentinel-2 images acquired on 2 and 7 July 2019; (b) cumulative probability of combustion given by 100-run numerical simulations
Figure 7 in: Guardo, R., Bilotta, G., Ganci, G., Zuccarello, F., Andronico, D., & Cappello, A. (2024). Modeling Fire Hazards Induced by Volcanic Eruptions: The Case of Stromboli (Italy). Fire, 7(3), 70.
Official, Map sheet or poster
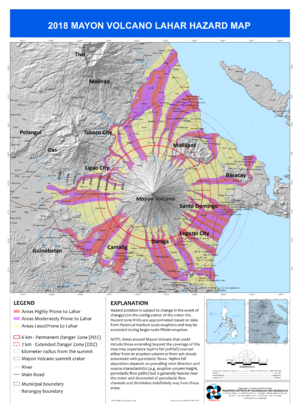
2018 Mayon Volcano Lahar Hazard Map
Philippine Institute of Volcanology and Seismology (PHIVOLCS). (2018). 2018 Mayon Volcano Lahar Hazard Map.
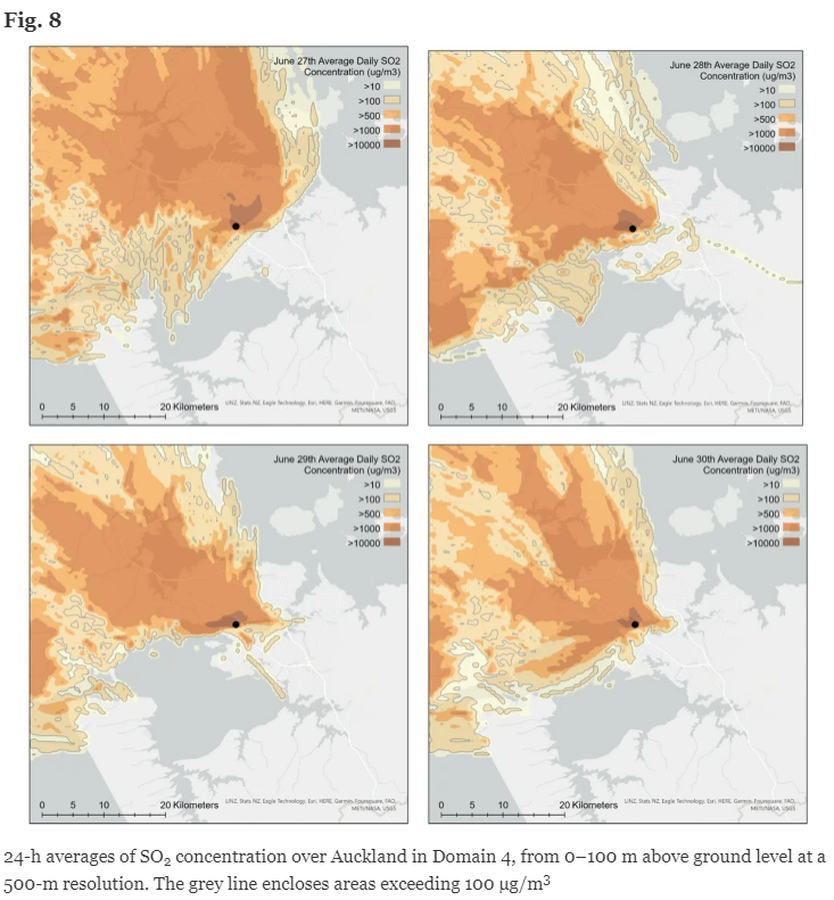
Figure in a journal article
24-h averages of SO2 concentration over Auckland in Domain 4, from 0–100 m above ground level at a 500-m resolution
Figure 8 in: Brody-Heine, S., Katurji, M., Stewart, C., Wilson, T., Smid, E. R., & Trancoso, R. (2024). Modeling SO2 dispersion from future eruptions in the Auckland Volcanic Field, New Zealand. Journal of Applied Volcanology, 13(1), 1-18.
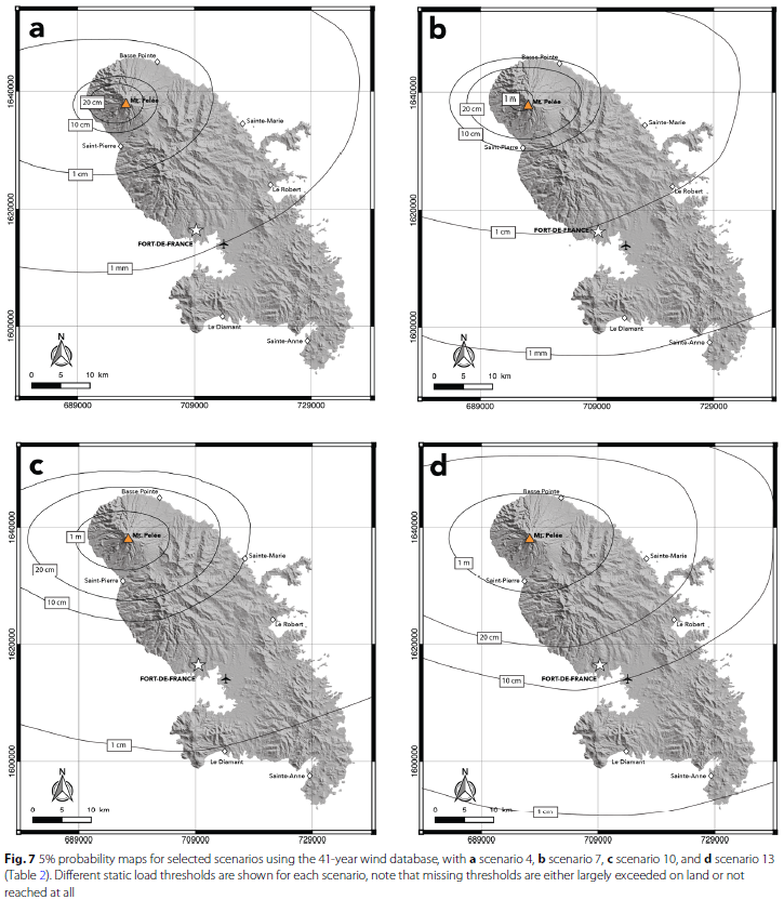
Figure in a journal article
5% probability maps for selected scenarios
Figure 7 in: Michaud-Dubuy, A., Carazzo, G., & Kaminski, E. (2021). Volcanic hazard assessment for tephra fallout in Martinique. Journal of Applied Volcanology, 10(1), 1-20. https://doi.org/10.1186/s13617-021-00106-7.
Official, Map in an information statement
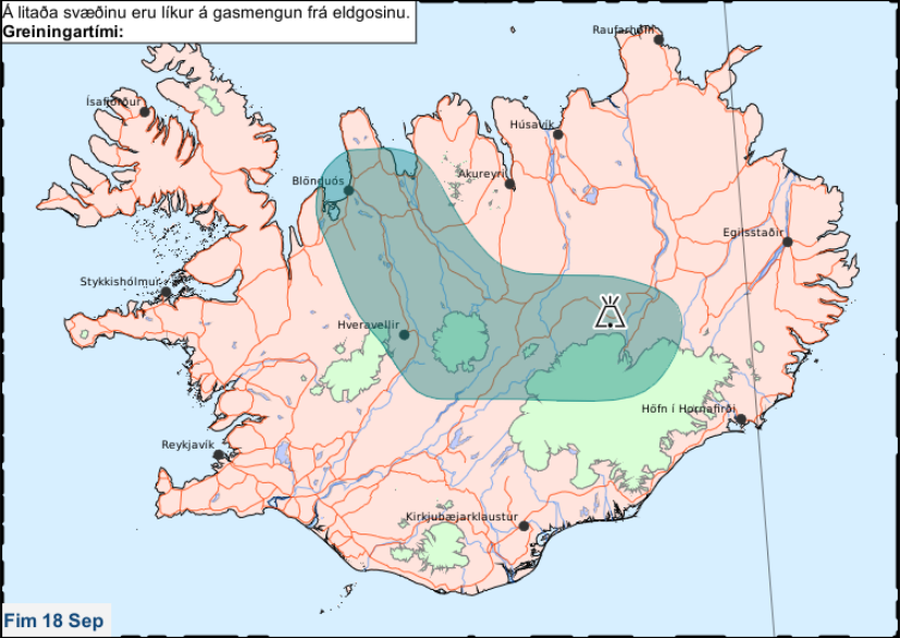
Á litaða svæðinu eru líkur á gasmengun frá eldgosinu. Fim 18 Sep.
(In the colored area there is a likelihood of gas pollution from the eruption. Thu 18 Sep.)
Iceland Meteorological Office (IMO). (2014). Á litaða svæðinu eru líkur á gasmengun frá eldgosinu. Fim 18 Sep.
Official, Figure in hazard assessment
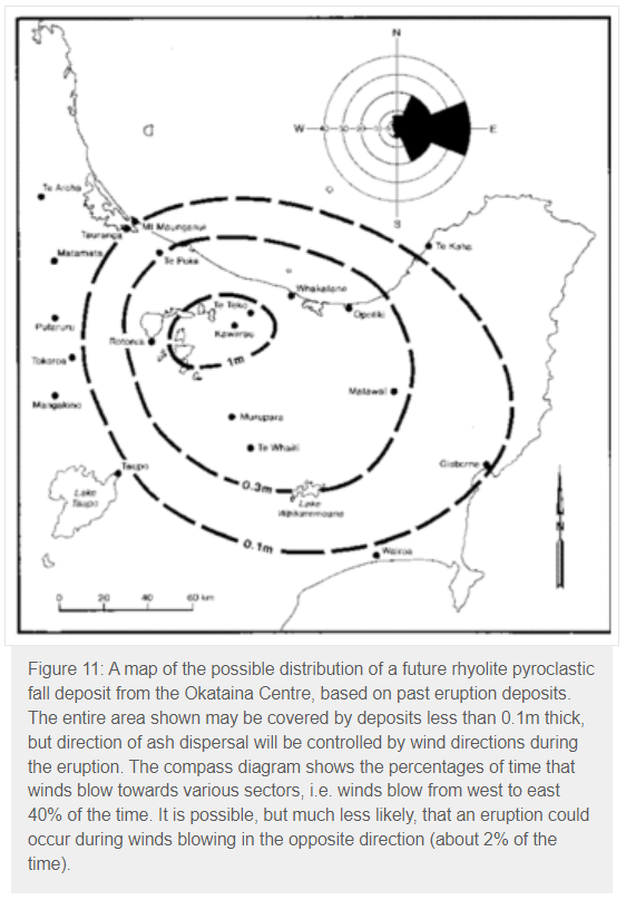
A map of the possible distribution of a future rhyolite pyroclastic fall deposit from the Okataina Centre, based on past eruption deposits
Figure 11 in: Nairn, I.A. (1993). Volcanic hazards at Okataina Centre. 3rd ed. Ministry of Civil Defence, Palmerston North, NZ. Volcanic hazards information series 2. 29 p. Reproduced on website: https://www.gns.cri.nz/Home/Learning/Science-Topics/Volcanoes/New-Zealand-Volcanoes/Volcano-Geology-and-Hazards/Okataina-Volcanic-Centre-Geology
Official, Figure in a journal article
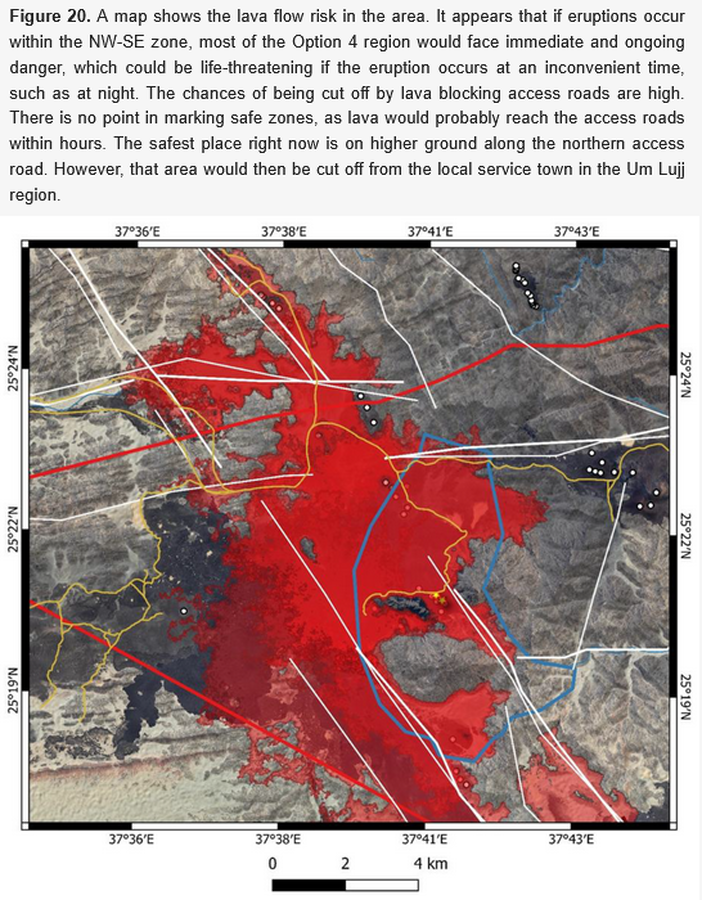
A map shows the lava flow risk in the area
Figure 20 in: Németh, K., Sowaigh, A., Ashor, M., Toni, M., & Sokolov, V. (2026). Volcanic Hazard Assessment of a Monogenetic Volcanic Field with Sporadic and Limited Information: Deterministic Approach for Harrat Lunayyir, Saudi Arabia. GeoHazards, 7(1), 33. https://doi.org/10.3390/geohazards7010033
Official, Figure in a journal article
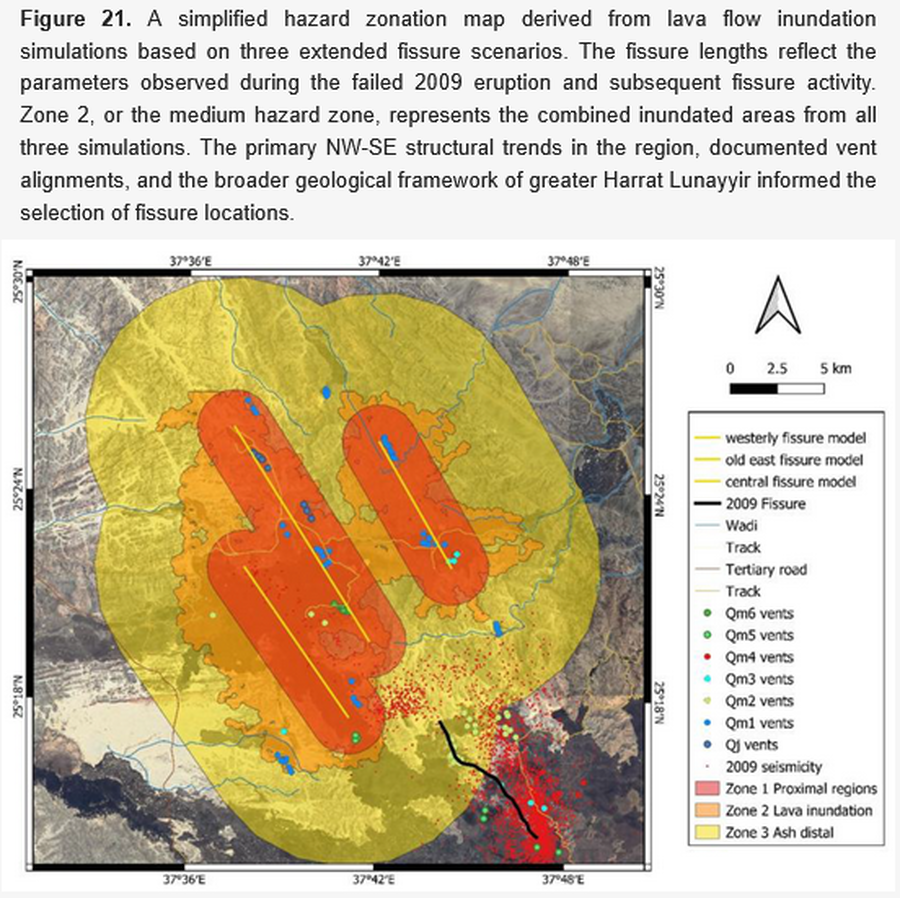
A simplified hazard zonation map derived from lava flow inundation simulations based on three extended fissure scenarios
Figure 21 in: Németh, K., Sowaigh, A., Ashor, M., Toni, M., & Sokolov, V. (2026). Volcanic Hazard Assessment of a Monogenetic Volcanic Field with Sporadic and Limited Information: Deterministic Approach for Harrat Lunayyir, Saudi Arabia. GeoHazards, 7(1), 33. https://doi.org/10.3390/geohazards7010033
Official, Figure in hazard assessment
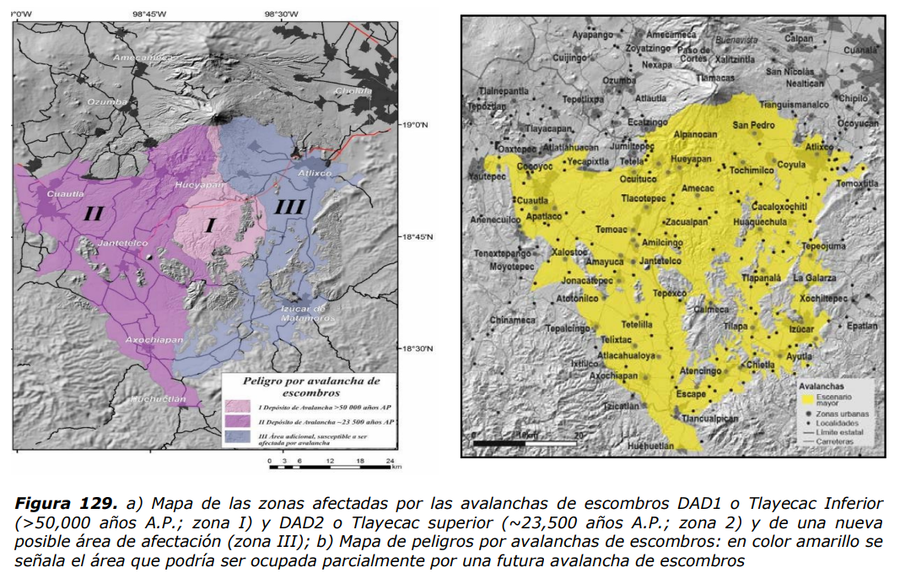
a) Mapa de las zonas afectadas por las avalanchas de escombros DAD1 o Tlayecac Inferior (>50,000 años A.P.; zona I) y DAD2 o Tlayecac superior (~23,500 años A.P.; zona 2) y de una nueva posible área de afectación (zona III); b) Mapa de peligros por avalanchas de escombros: en color amarillo se señala el área que podría ser ocupada parcialmente por una futura avalancha de escombros
(a) Map of the areas affected by debris avalanches DAD1 or Lower Tlayecac (>50,000 years BP; zone I) and DAD2 or Upper Tlayecac (~23,500 years BP; zone 2) and of a new possible area of affectation (zone III ); b) Debris avalanche hazard map: yellow indicates the area that could be partially occupied by a future debris avalanche)
Figure 129 in: Martin Del Pozzo, A.L, Alatorre Ibargüengoitia M., Arana Salinas L., Bonasia R., Capra Pedol L., Cassata W., Cordoba G., Cortés Ramos J., Delgado Granados H., Ferrés López M.D., Fonseca Álvarez R., García Reynoso J.A., Gisbert G., Guerrero López D.A., Jaimes Viera M., Macías Vázquez J.L., Nieto Obregon J., Nieto Torres A., Paredes Ruiz P.A., Portocarrero Martínez J., Renne P., Rodríguez Espinosa D.M., Salinas Sánchez S., Siebe Grabach C., & Tellez Ugalde E. (2017). Estudios geológicos y actualización del mapa de peligros del volcán Popocatépetl. Memoria técnica del mapa de peligros del volcán Popocatépetl. Instituto de Geofísica, Universidad Nacional Autónoma de México (UNAM).