Hazard maps can be classified according to whether they are hazard level-focused, with different hazard processes integrated into hazard level zones; or whether they are hazard process-focused with separate zones for different hazard processes (e.g. lahars, lava flows).
Hazard level-focused/Integrated by hazard level
Hazard level-focused maps (Figure 1) combine all or most hazard processes under consideration into integrated hazard level zones (often resembling a ‘bulls-eye’) that are defined by the relative level of hazard (e.g. high-medium-low) rather than the type of hazard. Often, hazard level-focused maps list which hazard processes might be expected in each of the zones; sometimes only the relative hazard level is presented. Some maps of this type may display only one integrated danger zone. Some maps also show a series of single-hazard-process insets (e.g. Galeras, Colombia, 1997) in addition to the main hazard level-focused map. Distal tephra fall hazards are sometimes displayed separately from the rest of the hazards on these maps (e.g. Antillanca, Chile, 2012).
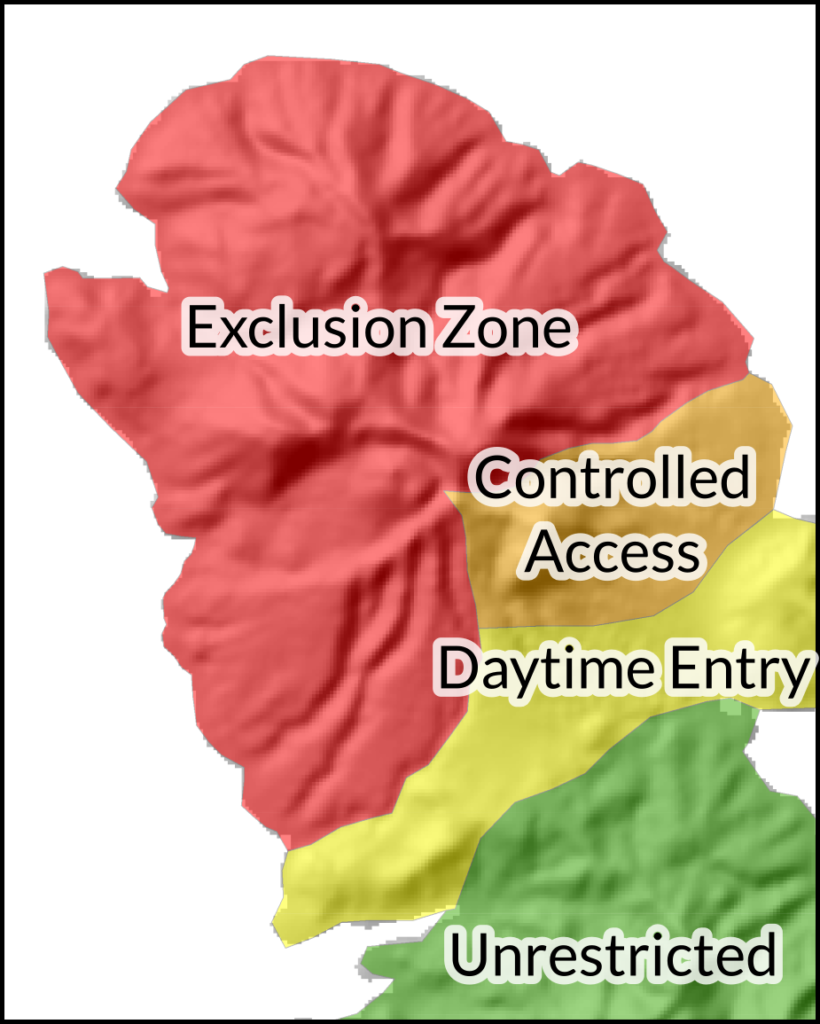
A special type of hazard level-focused map is an administrative hazard map (Figure 2) where the shape and hazard level of the zones is determined through a combination of hazard information and administrative concerns (e.g. civic boundaries). Often, administrative zone boundaries remain static, but access to zones changes with changing conditions (e.g. Soufrière Hills, Montserrat)
Hazard level-focused map make relative hazard levels very simple to understand and are thus especially effective for communicating hazard levels to the general public. However, the basis for the zones is not very transparent and the method for integrating hazards from different hazard processes is not easily discerned from the map itself, although sometimes accompanying materials explain the integration process.
Examples of hazard level-focused map are: Nevado del Tolima, Colombia (2007), Liamuiga, St. Kitts (2005), and Ruapehu, New Zealand.
A full list of hazard level-focused map from the database can be found here.
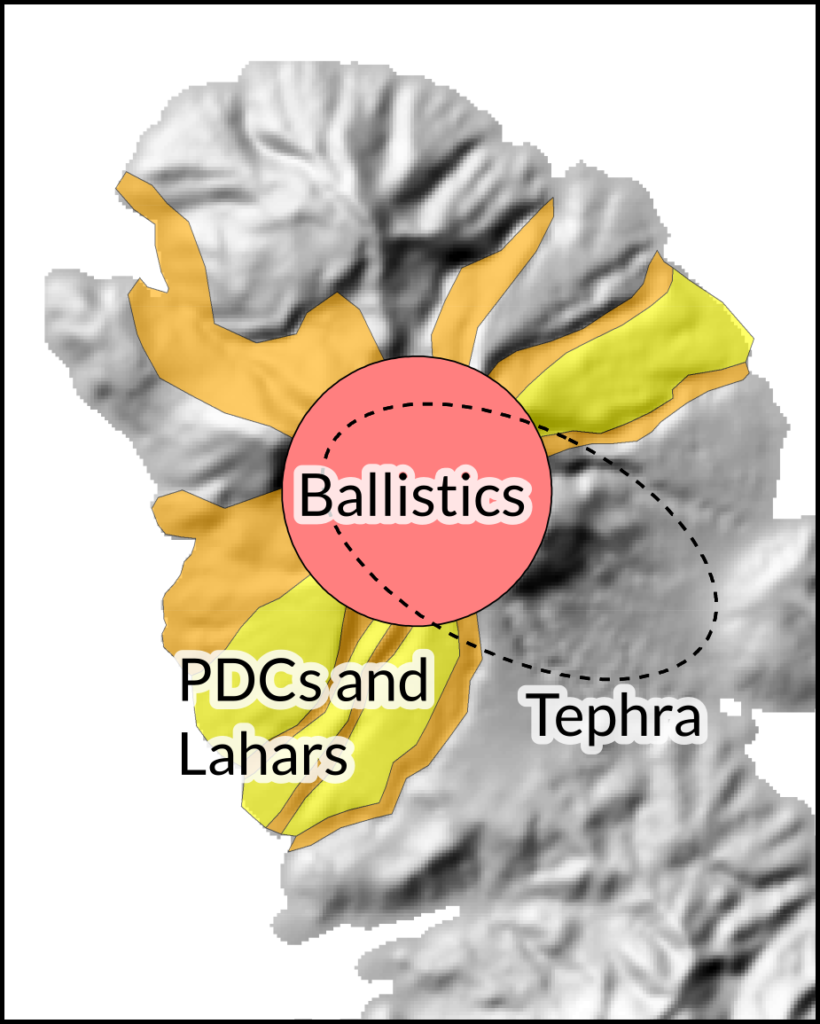
Hazard process-focused/Separated by hazard process type
Hazard process-focused maps (Figure 3) have different zones for each hazard process under consideration. These zones are primarily defined by the hazard process type under consideration.
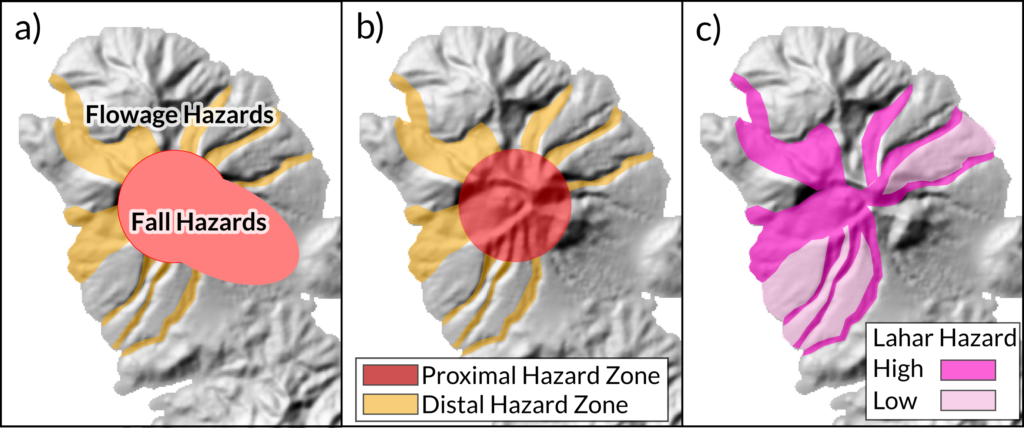
On some maps, hazards processes are grouped by process type (Figure 4a); for example, lava flows, lahars, and pyroclastic density currents might be combined into one ‘flowage’ hazard zone (e.g. California Volcanoes, USA, 1989) with tephra and ballistics grouped into a ‘fall’ hazard zone. Other maps may group hazard processes by location (Figure 4b); for example, into proximal and distal or regional hazard zones (e.g. Crater Lake, USA 1997). Some maps show only one hazard process per map (Figure 4c); often with a set of different maps for each hazard process (e.g. Popocatépetl, Mexico, 2016: tephra, ballistics, and lahars)
For hazard process-focused maps, the geologic reasoning behind the hazard zones is easily perceived, but relative hazard levels between zones may be more difficult to understand. However, hazard process-focused maps may include multiple hazard levels for some phenomena (e.g. high-medium-low lava and lahar zones, Llaima, Chile 2003). Hazard process-focused maps may be especially useful for land-use planning because the different hazard process types may have different impacts and implications for planning purposes.
Some examples of hazard process-focused maps include: Adams, USA (1995), Calbuco, Chile (1999), and Liamuiga, St. Kitts (2005).
A full list of hazard process-focused maps from the database can be found here.
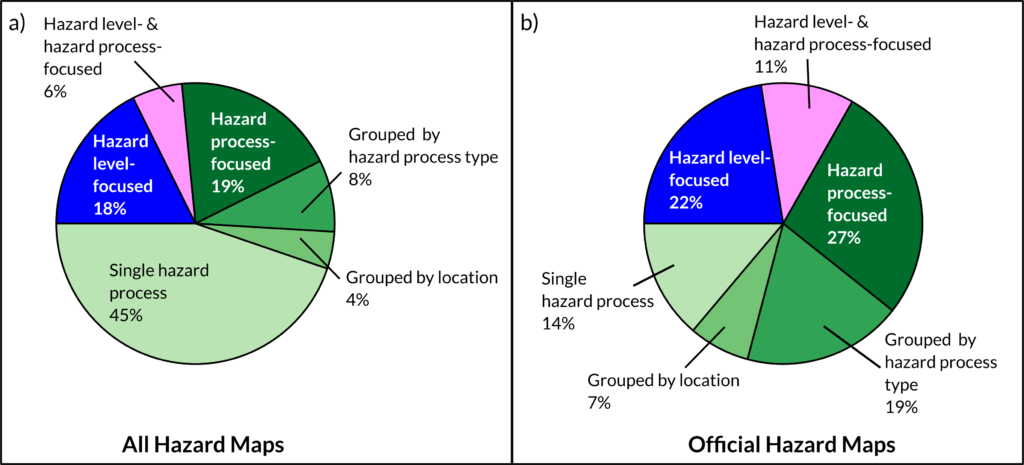
Frequency of Hazard Presentation Types
Figure 5 shows the relative frequency of hazard maps in the database that are integrated into hazard level-focused zones or separated into hazard process-focused zones. For the entire database (Figure 5a), single hazard process maps dominate, likely because of the inclusion of maps from academic literature that are often focused on developing or testing models for specific hazards. Official hazard maps (Figure 5b) tend to either depict hazard processes separately in hazard process-focused zones (27%), to combine hazards into hazard level-focused zones (22%), or to group hazard processes by type (e.g. fall or flowage hazard, 19%).