Hazard maps label hazard zones and define their probabilities in different ways. Maps often use a combination of label and probability types for different hazards or may give multiple hazard zone labels or probability definitions.
Hazard Process Name

Hazard zones are frequently labeled using the name of the hazard process (Figure 1). This is especially common on hazard process-focused maps. Maps where zones are labeled using the hazard process name may or may not also give a probability for the zones. Examples of maps defining zones by hazard process name include: Llaima, Chile (2003); Soufrière St. Vincent, Saint Vincent and the Grenadines (2005); and Tanaga, USA (2007).
A full list of maps in the database labeling zones by hazard process name can be found here.
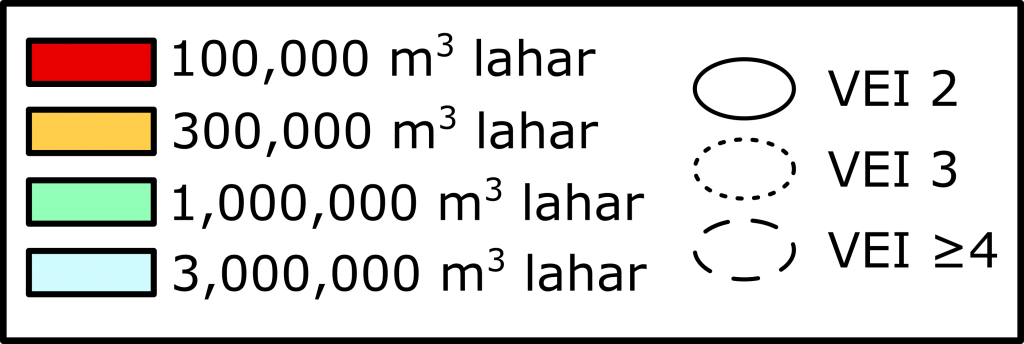
Scenario Name
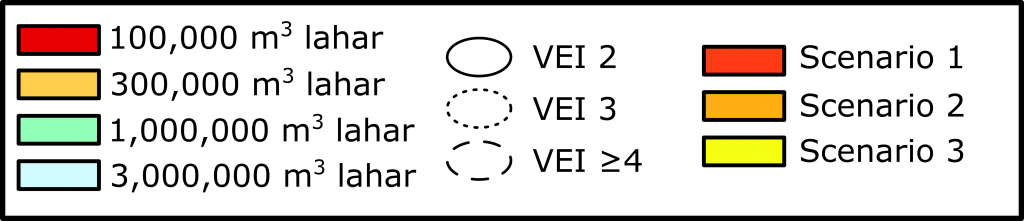
Maps may label hazard zones using the scenario name (Figure 2) or scenario attributes (e.g. LAHARZ model volumes, eruption VEI). Maps where zones are labeled using the scenario name may or may not also give a probability for the zones. Maps that define zones using scenario names include: Santa Ana, El Salvador (2004); Agua, Guatemala (2001); and Corcovado, Chile (2012) tephra accumulation inset.
A full list of maps in the database labeling hazard zones by scenario name can be found here.
Access
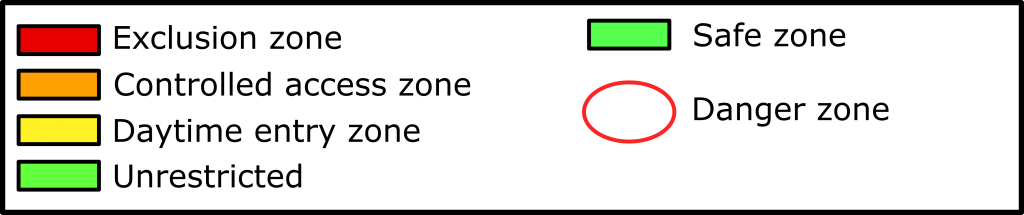
Some maps have zones labeled only by access level (e.g. exclusion zone, danger zone, daytime entry zone) (Figure 3). Examples of maps with access zones include: Soufrière Hills, Montserrat (2014); Ruapehu, New Zealand; and Bulusan, Philippines (2016).
A full list of maps in the database using access zones can be found here.
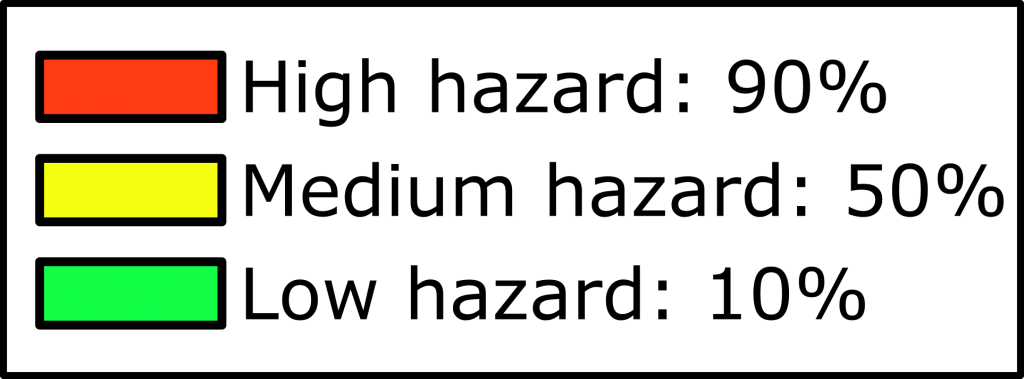
Qualitative Relative Probability
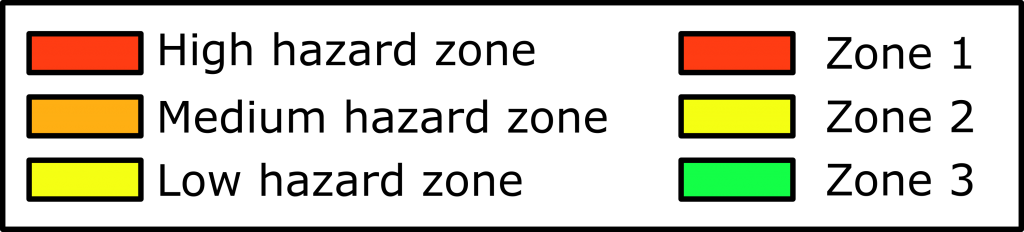
Hazard zones are commonly labeled using qualitative or relative probabilities (Figure 4). These are usually defined as high-medium-low hazard zones or most-likely or worst-case zones, but sometimes they are only numbered or ordered. Examples from the database include: Popocatépetl, Mexico; Guallatiri, Chile (2013) and Dominica (2005).
A full list of maps in the database with zones labeled using qualitative relative probabilities can be found here.
Numeric Probability
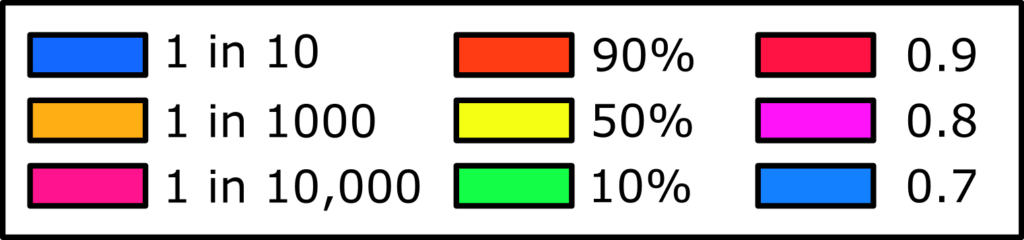
Relatively fewer maps label zones or define probability using numeric (including annual) probabilities (Figure 5). These may be expressed as percentages (20%), natural frequencies (1 in 20), or as decimals (0.5). These maps usually involve probabilistic modeling. Numeric probabilities may only be given for one hazard process, often for tephra fall. Numeric probabilities are more common on maps published in scientific journals. Examples of maps in the database that label zones using numeric probabilities include: Baker, USA (1995); Apagado, Chile (2013, tephra zone inset); and Karthala, Comoros (2019).
A full list of maps in the database labeled using numeric probabilities can be found here.
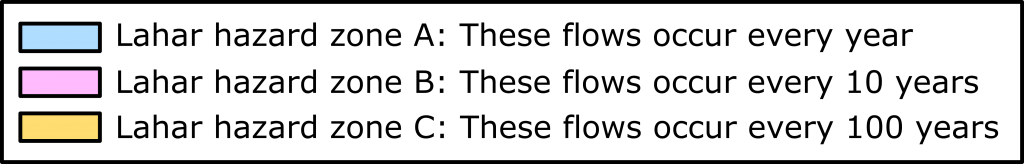
Recurrence Interval
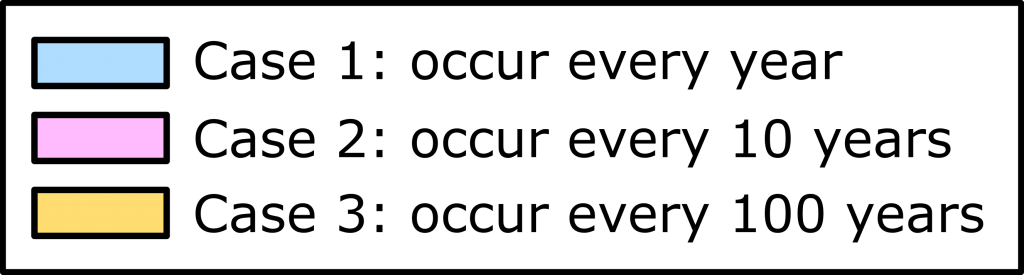
A few hazard maps label zones using recurrence intervals or rates (Figure 6) instead of probabilities (e.g. 1 every 10,000 years). Some examples of maps that label zones using recurrence intervals include: Haleakala, USA (1983) and Rabaul, Papua New Guinea (1985).
A full list of maps in the database labeled using recurrence intervals can be found here.
Estimated Value or Hazard Intensity Metric (HIM)
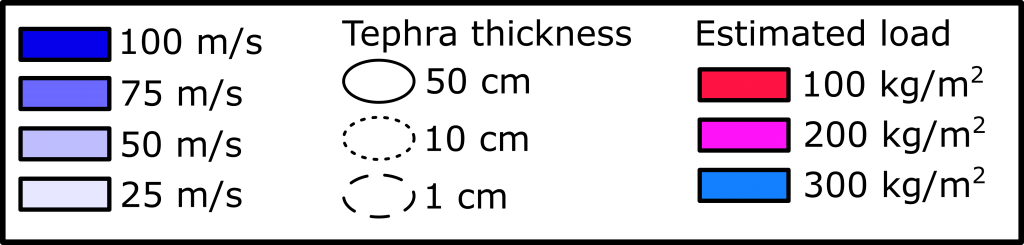
Sometimes, zones may be labeled using a particular estimated value (Figure 7), such as tephra thickness or grain size, load, arrival time, or overpressure. These parameters are sometimes referred to as Hazard Intensity Metrics (HIMs). Examples include: Holuhraun, Iceland (2014); Popocatépetl, Mexico (2016);and Reventador, Ecuador (2011) tephra hazard zone.
A full list of maps in the database labeled using estimated values or hazard impact metrics can be found here.
Location or source name
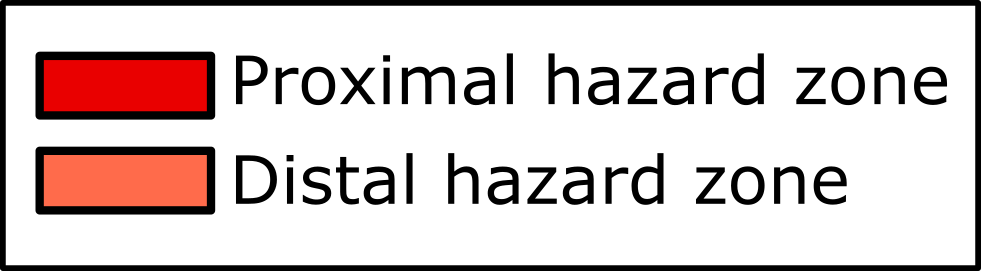
Some maps label zones using proximal and distal locations (Figure 8), specific location names (e.g. town names), or eruptive source names (i.e. zones are labeled by eruptive center).
A full list of maps in the database with zones labeled by location can be found here.
The most frequent way that hazard zones are labelled by maps in the database (Figure 9) is by hazard name (37%), followed by qualitative probability (32%). Note that these sum to >100% because maps may have multiple types of zone definitions.
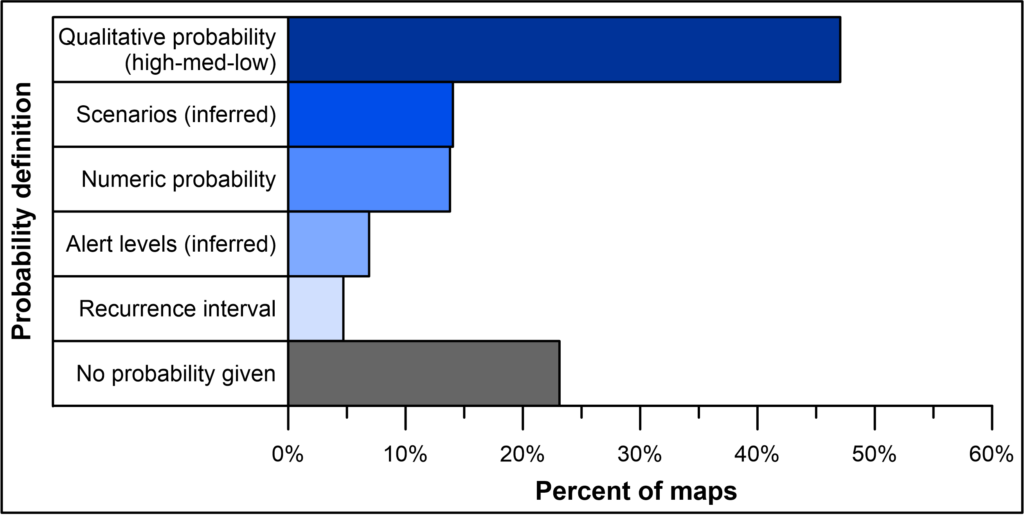
Probability definitions
Hazard zone probability can be defined using qualitative or relative probabilities (e.g.high-medium-low, full list here), numeric probabilities (full list here), or recurrence intervals (full list here). Many maps do not define probability in any way (full list here). However, Some while maps give no explicit probability definition, relative probability can be inferred from the scenario or the corresponding alert level.
The most frequent way that probabilities are defined by maps in the database (Figure 10) is using qualitative probabilities (47% of maps). About 14% of maps give numeric probabilities, and 5% give recurrence intervals. About 23% give no probability definition at all. Relative probability can be inferred from scenario type on about 14% of maps, and from alert level on about 7% of maps. Note that these sum to >100% because maps may have multiple probability definitions (e.g. the lahar hazard zone may have qualitative probabilities while the tephra hazard zone has numeric probabilities, as in Figure 10).
Hazard zones may have both a zone label and a probability definition. Zone labels and probability definitions may vary by hazard zone, as in Figure 11.
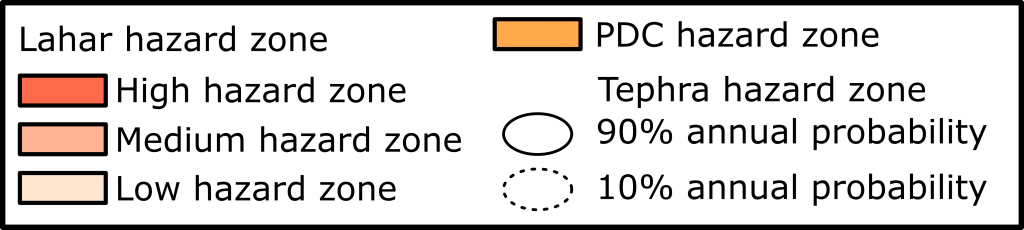
Probability might be discussed in the zone description in the legend (Figure 12) or in descriptive text elsewhere on the map; there may be multiple probability types given on the same map (e.g. qualitative and numeric probabilities, Figure 13); or there may be no probability given at all (Figure 14).