Hazard maps can be classified into three main categories based on scale. From large to small scale these are: flank- or drainage-scale maps, volcano-scale maps, or regional-scale maps. Some maps display data on more than one scale or feature user-selectable scales.
Volcano-scale maps
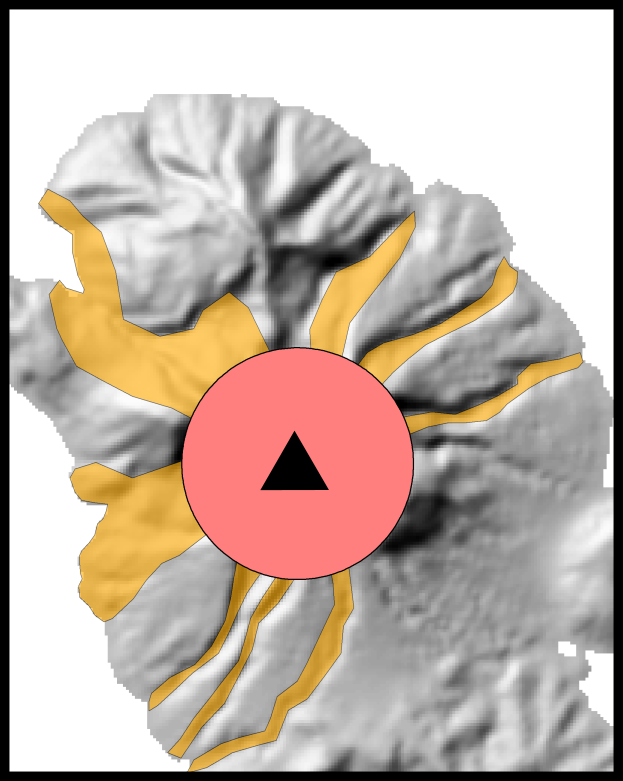
Most commonly, hazard maps depict the volcano and the surrounding area (Figure 1). These maps balance the need for detail with the need to depict distal hazards. These maps tend to be all- or multi-purpose maps, used for hazard awareness, planning, and crisis management.
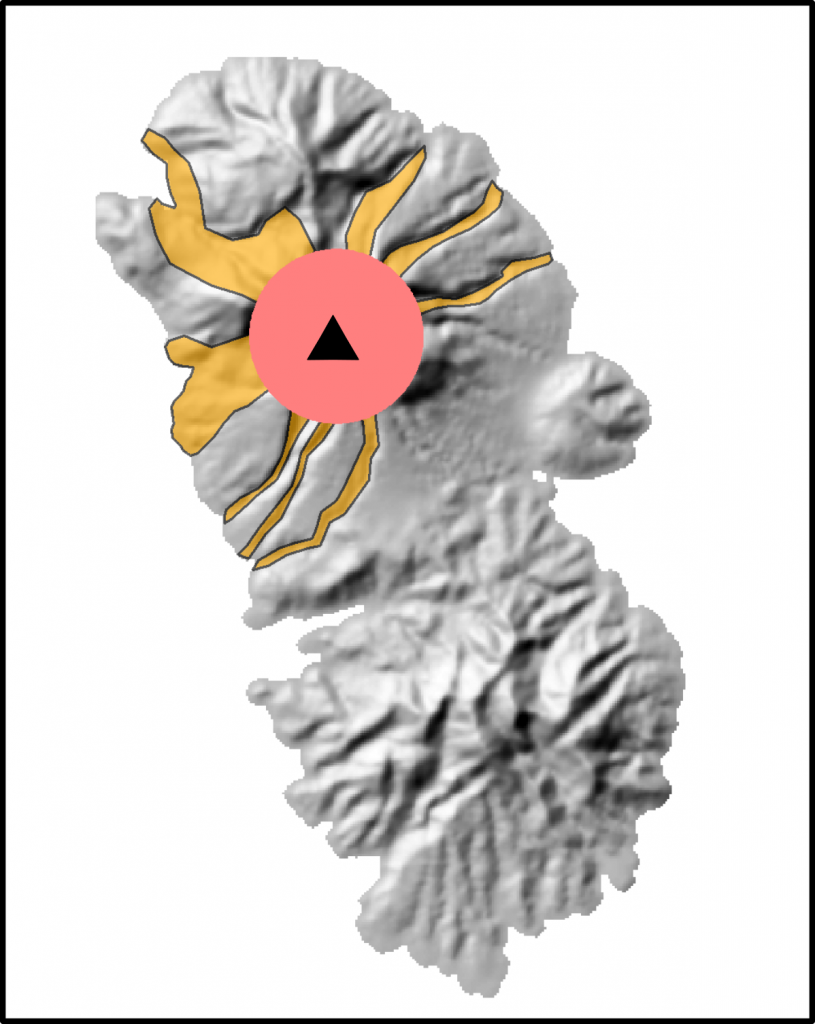
For some maps (Figure 2), this may include an entire island (e.g. Soufrière St. Vincent, 2005) and can involve special considerations, such as the inclusion of maritime hazard zones .
Examples of volcano-scale maps include: Corcovado, Chile (2012); Egon, Indonesia (2005); and Vesuvius, Italy (2015).
A full list of volcano-scale maps in the database can be found here, and those covering entire islands can be found here.
Regional-scale maps
Regional-scale hazard maps depict a large area, often showing only distal hazards, such as tephra and lahar hazards (Figure 3). Many regional hazard maps depict the hazards from many volcanoes and may cover entire countries. These maps are more commonly used for large-scale land-use planning purposes and cannot display the same level of hazard detail as more local-scale maps.
Some examples of regional-scale maps include: Chile (2011); Kamchatka, Russia (1962); and the Cascades, USA (2013).
A full list of regional-scale maps in the database can be found here.
Flank- or drainage-scale maps
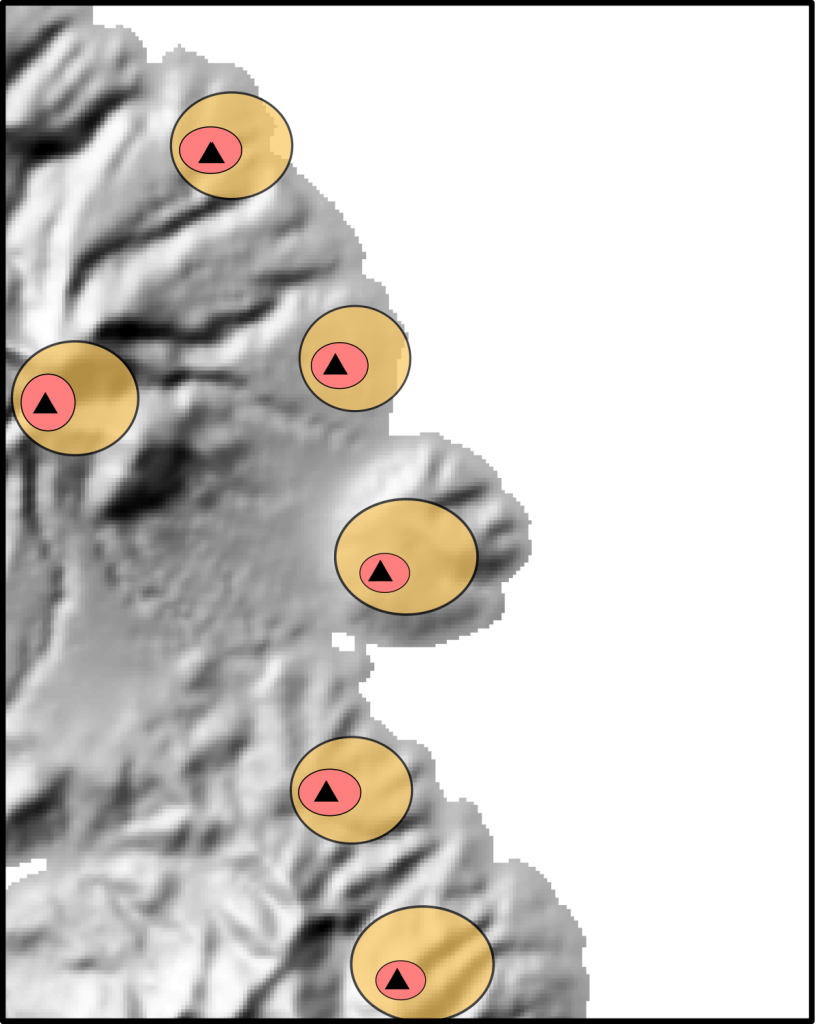
Conversely, some hazard maps focus only on particular flanks or drainages of the volcano (Figure 4). These maps tend to show more hazard and local infrastructure detail than those at other scales and tend to be tailored for particular communities at risk. They are often used to manage crises. They are often part of a series or set of maps focusing on different flanks or drainages of the volcano.
Some examples of flank-scale maps include: Ruapehu, New Zealand; Rainier, USA (2003); and Tenerife, Canary Islands, Spain (2007).
A full list of flank- or drainage-scale maps in the database can be found here.
Multiple spatial scales
Some interactive maps, or maps with multiple small inset maps, may show the same hazards at multiple scales, often selectable by the user.
Examples of maps with multiple scales include the interactive, web-based maps at: Cumbal, Colombia; Reventador, Ecuador (2019); and Mayon, Philippines.
A full list of multi-scale maps in the database can be found here.
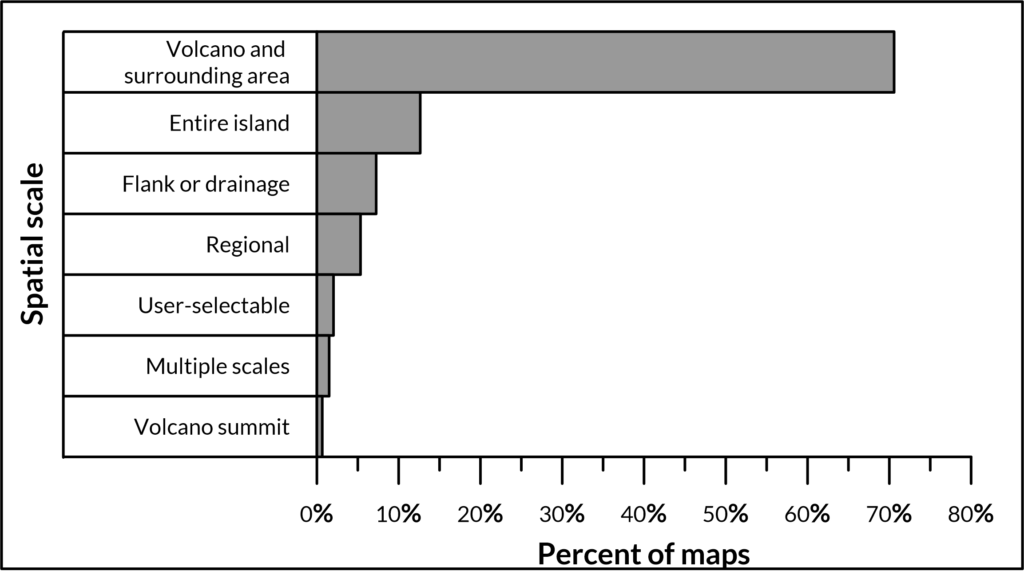
Frequency of spatial scales
Most commonly, hazard maps in the database depict the volcano and the surrounding area (71% of maps, Figure 5). Maps depicting an entire small island are also fairly common (13%). Maps depicting a particular flank or drainage make up about 7% of maps each. Regional scale maps make up 5% of the maps in the database. Some interactive maps (2%) allow the user to select the scale. Maps with multiple small insets, may show the same hazards at multiple scales (1%). A few maps focus only on the summit of the volcano (<1%).