
Hazard maps can be classified by the zonation methodology employed; we list the categories we used in the database below. All maps use the available geologic history of the volcano in one form or another (directly or as model inputs, for example). Maps often incorporate multiple methods; for example, they may use geologic history for lahar hazards and simple modeling for pyroclastic density current hazards. Note that the final hazard presentation may be hazard level-focused or hazard process-focused, no matter the methodology used. The final map design may not and need not reflect the map-making methodology as apparently as in these illustrations. The final design of the map should reflect the audience and purpose of the map.
Geologic History
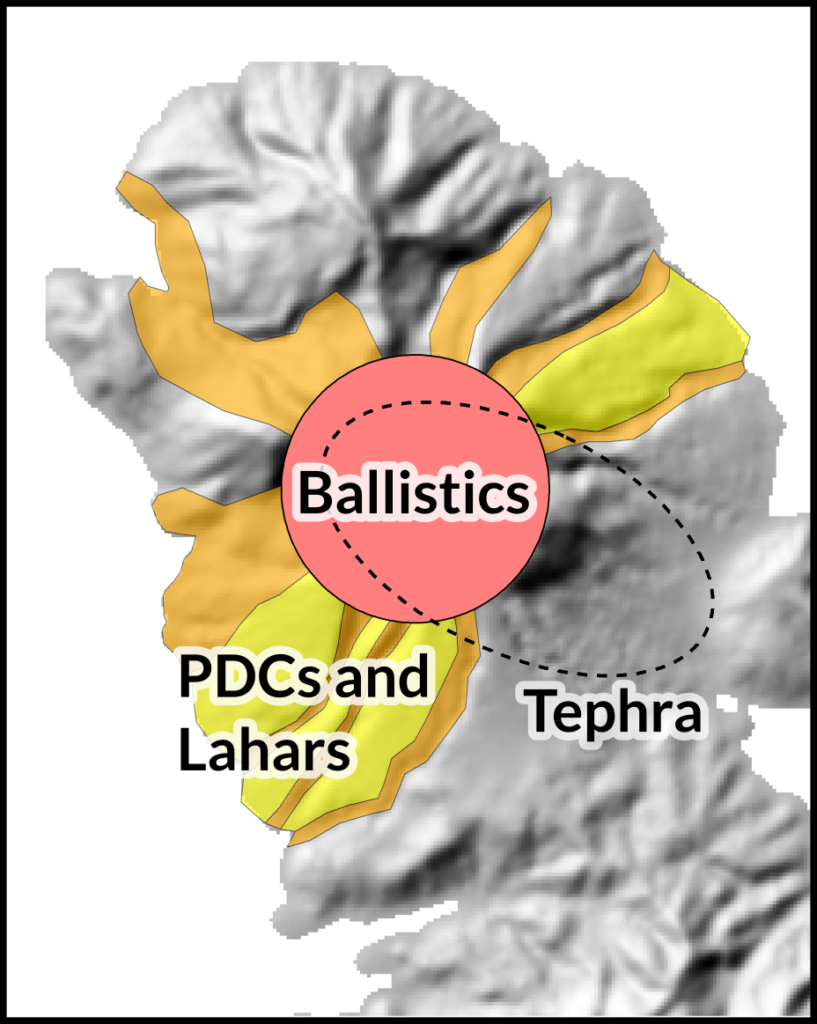
The most common hazard zonation methodology is based on geologic history (Figure 1). This is a broad category of methodology and can incorporate eruptive history, field work and knowledge of deposits, and information from analog volcanoes. An important limitation of geology-based hazard maps is that the geological record represents an incomplete and biased catalog of events, and consequently, any hazard maps based solely on mapped distributions of deposits may not reflect all possible future events. However, some maps specifically incorporate information from other analog volcanoes (e.g. Makushin, USA 2000) or explain or visualize uncertainty using cartographic elements to try and mitigate these limitations. Sometimes, maps based on geologic history also use expert elicitation or event tree exercises in order to incorporate broader geologic knowledge and analog information (e.g. Soufrière Hills, Montserrat 2014).
Examples of maps using geologic history include: Ambae, Vanuatu (2019), Baker, USA (1978), Soufrière St. Vincent, St. Vincent and the Grenadines (2005) and Villarrica, Chile (2015).
A full list of geology-based hazard maps from the database can be found here.
Modeling
Hazard maps may also incorporate results from computer models, either by directly displaying model outputs or by using expert knowledge and geologic history to modify model outputs and create hazard zones. Either simple, scenario-based modeling or fully probabilistic modeling may be performed, with maps using a wide range of empirical, spatial, or physical models. Input parameters for models are derived from the geologic history of the volcano in question, from a range of analog volcanoes, or from empirical relationships. Modeling-based methods have the advantage of considering events not recorded in the geologic record, of quantifying uncertainty, and of considering recent changes to topography that may cause hazards to behave differently than in the past.
Probabilistic Modeling
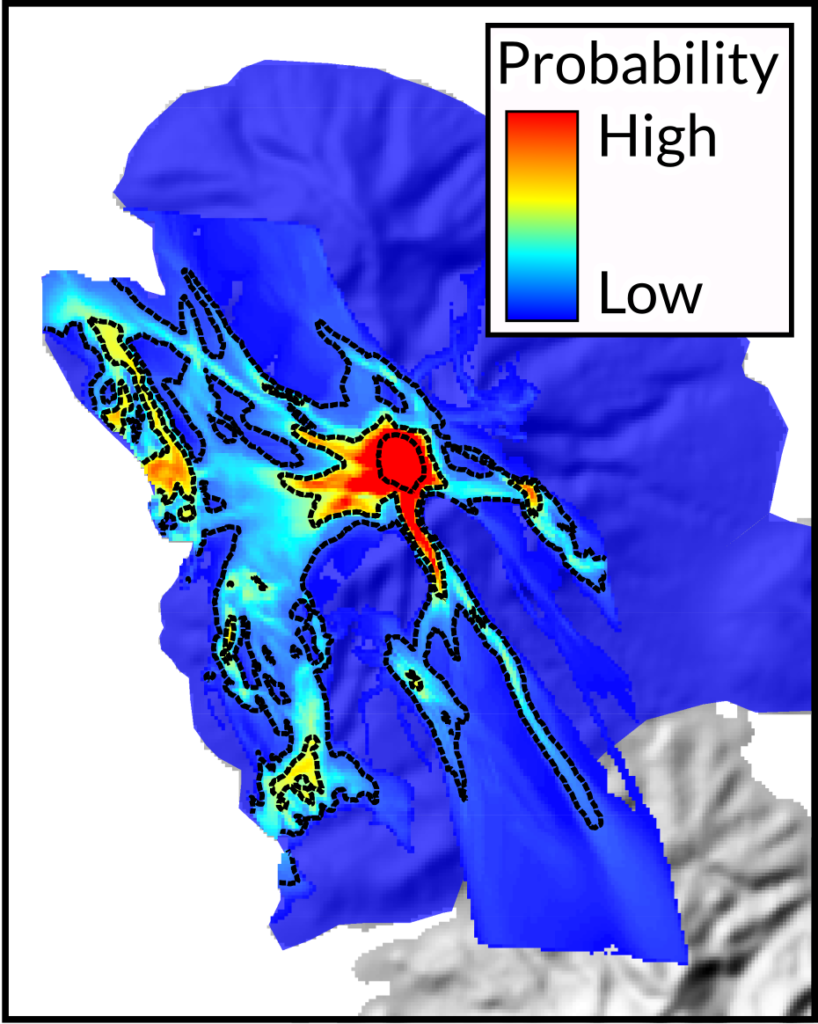
Hazard zones based on probabilistic modeling incorporate numerous model runs (typically many thousands) with a statistical treatment of the input parameters (Figure 2). Maps using probabilistic modeling sometimes display only a single hazard process and often display numeric probabilities of inundation, or of another hazard intensity metric (HIM), such as loading, thickness, or pressure. While probabilistic modeling is becoming increasingly common as advances in parallel computing make running many thousands of models feasible, this method is still relatively rare outside of maps in academic literature, except for tephra- or gas-dispersal maps. Aside from being computationally expensive, the principal limitation of using probabilistic modeling is that the results may be difficult to interpret or communicate given the complexities of the modeling strategy or of models themselves.
Some examples of maps using probabilistic modeling include: Chaitén, Chile (2015), Vesuvius, Italy (2017), Holuhraun, Iceland (2015), and Tenerife, Canary Islands [Spain] (2007).
A full list of maps from the database using probabilistic modeling can be found here.
Scenario-based Modeling
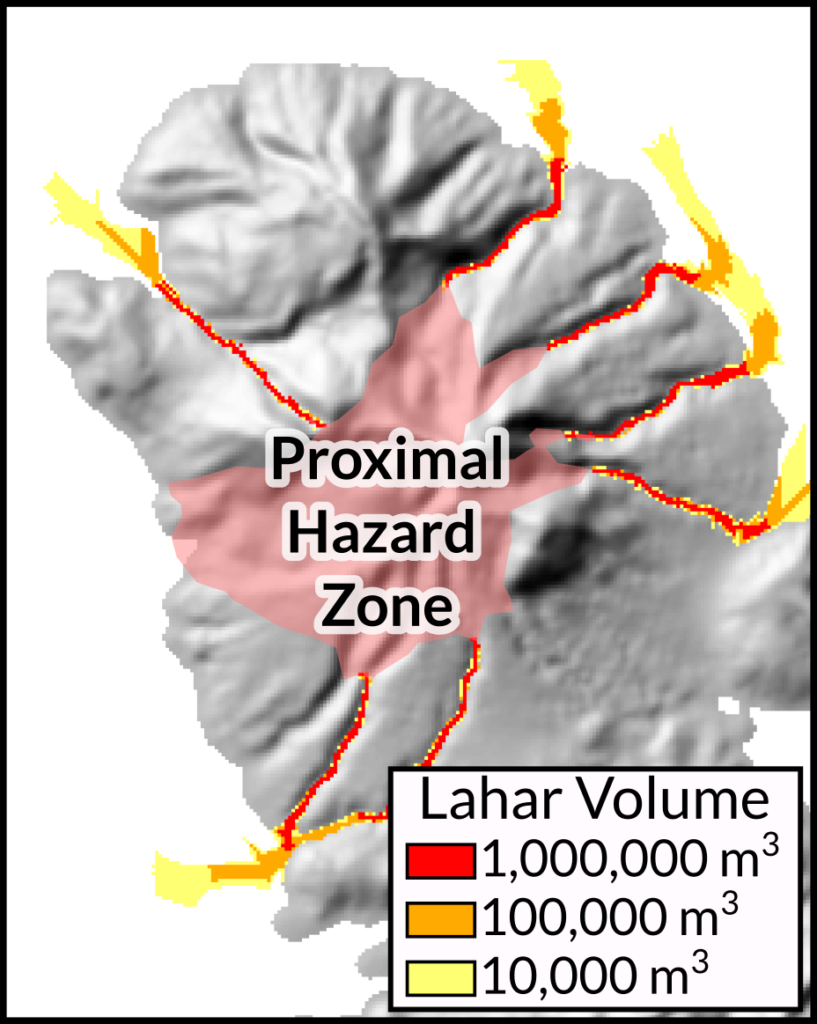
Scenario-based modeling (Figure 3) uses either simple empirical or semi-empirical models (e.g. energy cones, LAHARZ) or geophysical models (e.g. TITAN2D) to simulate multiple scenarios of interest. A range of scenario types may be used, including most-likely eruption style or size, worst-case scenarios, or commonly, a range of eruption sizes or hazard process volumes. Unlike probabilistic modeling, scenario-based modeling uses a limited number of model runs with input parameters selected to suit particular scenarios. Scenario-based modeling is less computationally expensive than probabilistic modeling.
Examples of maps using scenario-based modeling include: Bulusan, Philippines (2016), Great Sitkin, USA (2003), Fuego, Guatemala (2018), and Tungurahua, Ecuador (2008).
A full list of maps from the database using scenario-based modeling can be found here.
Community Participation
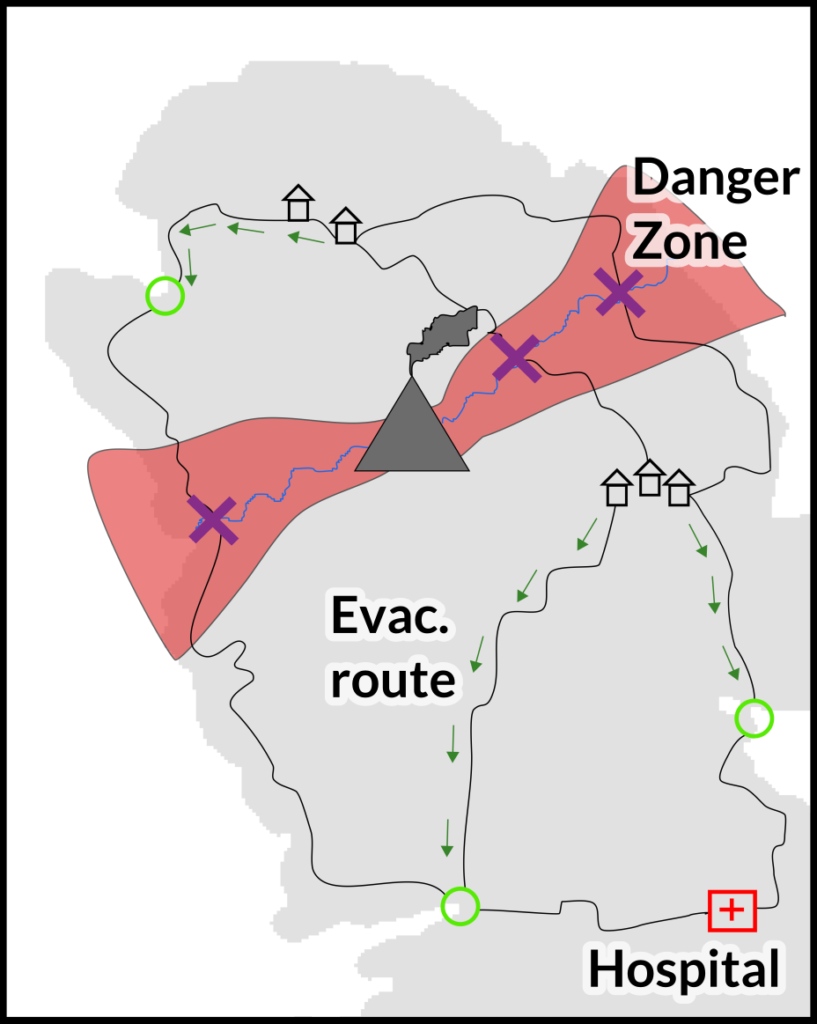
Participatory, or community-based, hazard maps are maps designed by and for communities surrounding volcanoes (Figure 4). Often created during collaborative workshops between scientists and community members, these maps focus heavily on social aspects of the hazard map, such as evacuation routes, shelters, hospitals, and muster points. These maps can be ephemeral and difficult to find unless published in academic literature, and are thus relatively rare in the database. Participatory hazard maps are also commonly hand-drawn or constructed as scale 3D models from craft supplies. Often, the hazard zones on these maps are relatively simple, geologically-speaking; they are commonly based on the experience of the community, oral and written histories, cultural beliefs, eruptive history, and input from participating scientists. However, the hazard information on the maps can also be very detailed in terms of impacts to local infrastructure, such as particular bridges or evacuation routes. Additionally, the maps often incorporate issues of vulnerability and risk; some identify individual households with elderly or pregnant inhabitants, for example (Merapi, Indonesia, 2012). Participatory hazard maps are often focused only on a single community or flank of the volcano.
Examples of maps using participatory methods include: Merapi, Indonesia (2007) and Ambae, Vanuatu (2001).
A full list of maps using community participation methods can be found here.
Derived
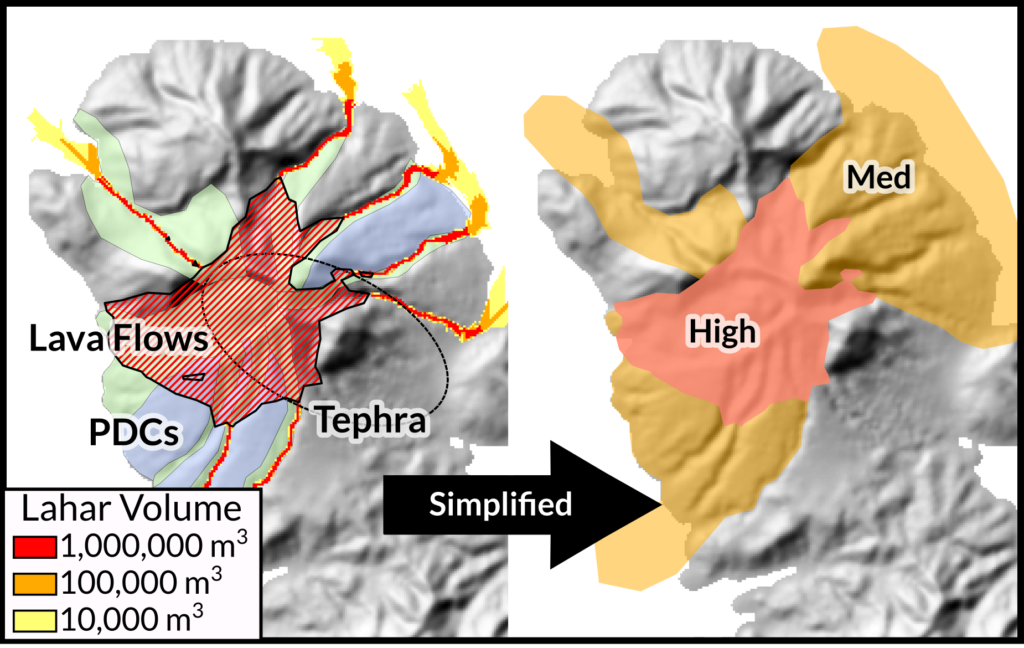
Derived hazard maps (Figure 5) are those that are adapted from another, existing hazard map in order to simplify the map or adapt an existing map to a different audience or purpose. These include maps that are simplified for signage around volcanoes, for public information fact-sheets, and for situational awareness among international aid groups. Maps may be simplified by the agency that created them, or by another agency to suit their needs.
Examples of maps derived or simplified from other maps include: Rainier, USA (2014), Popocatépetl, Mexico, and Lokon, Indonesia (2012).
A full list of derived or simplified hazard maps in the database can be found here.
Frequency of Zonation Methods
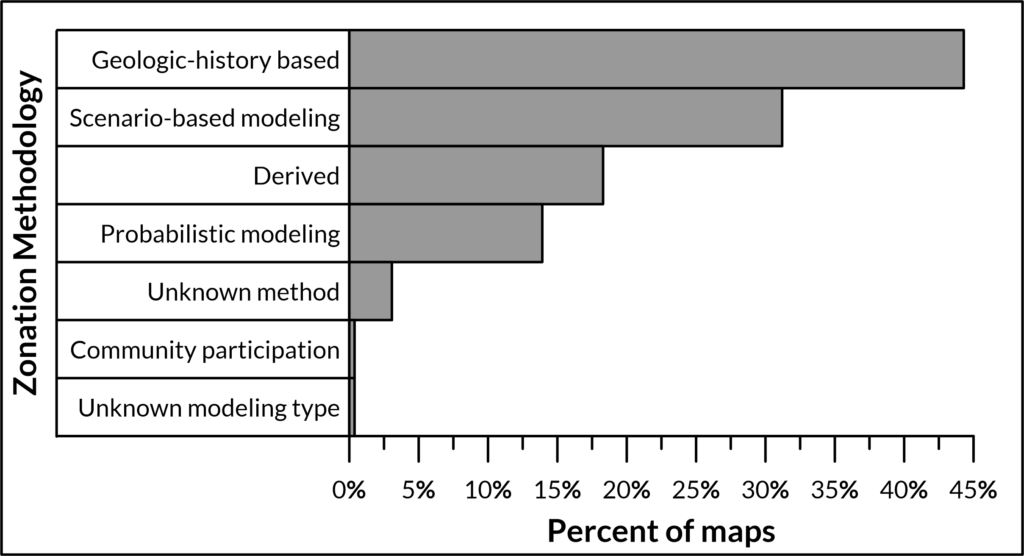
Geologic-history based maps (including those using expert elicitation and analog volcanoes) are the most common map by zonation method (Figure 6). Relatively few maps use community participation or probabilistic modeling. However, the prevalence of different zonation methods has changed through time as different models and methods have been developed (Figure 7).
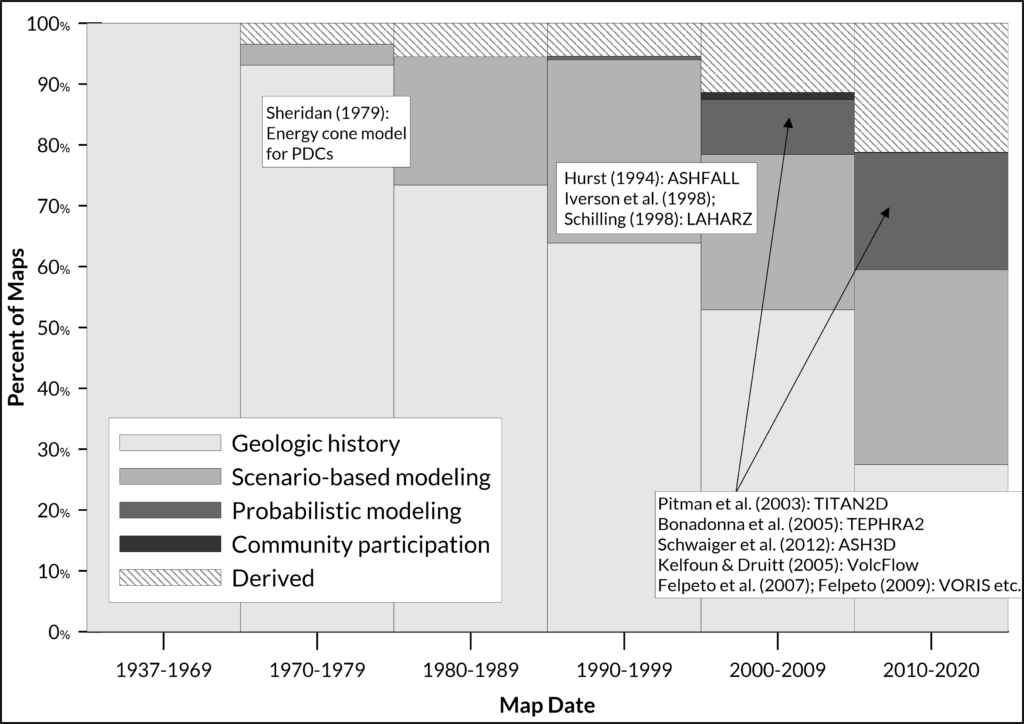
Figure 7 shows the evolution of zonation methods through time. Early maps are almost all geology-based. As empirical models, such as the energy cone model (Sheridan 1979) and LAHARZ (Iverson et al. 1998; Schilling 1998) were developed, a higher percentage of maps began to employ scenario-based modeling in the late 1970s-1990s. As physical models that can be run probabilistically, such as TITAN2D (Pitman et al. 2003), VolcFlow (Kelfoun & Druitt 2005), TEPHRA2 (Bonadonna et al. 2005), and ASH3D (Schwaiger et al. 2012), were developed and Bayesian event tree platforms were created (Marzocchi et al. 2004, 2008, 2010; Felpeto et al. 2007), a higher percentage of maps began to use probabilistic methods in the 2000s and 2010s. Recently, two efforts were responsible for the large increase in derived maps in the mid 2010s: one by the US Geological Survey to create simplified versions of all Cascades volcanoes for use on park signage and one by the Japan Meteorological Agency to create semi-standardized eruption alert leaflets, usually derived from existing hazard maps.