
Advanced Search for Maps
Showing 1-10 of 10
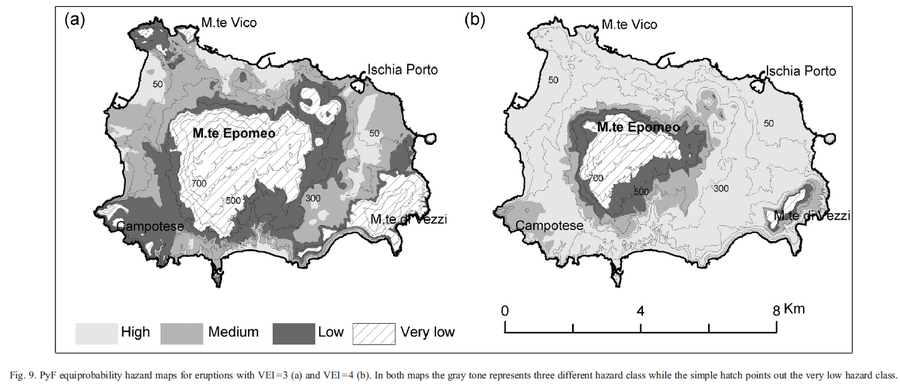
Figure in a journal article
PyF equiprobability hazard maps for eruptions with VEI = 3 and VEI = 4
Figure 9 in: Alberico, I., Lirer, L., Petrosino, P., & Scandone, R. (2008). Volcanic hazard and risk assessment from pyroclastic flows at Ischia island (southern Italy). Journal of volcanology and geothermal research, 171(1-2), 118-136.
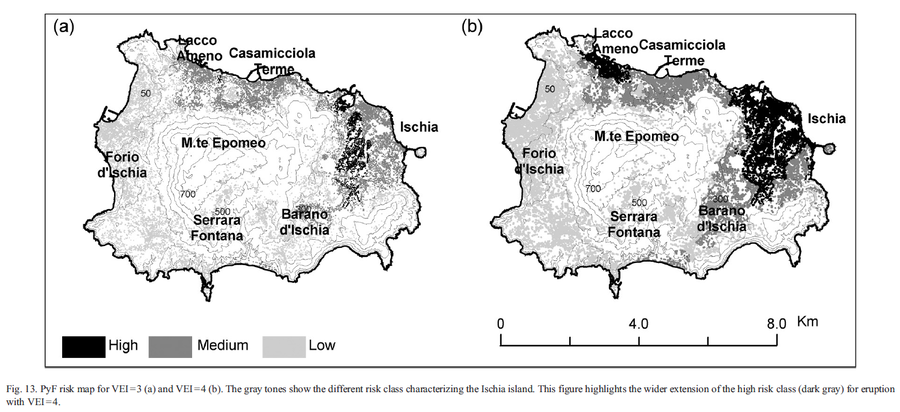
Figure in a journal article
PyF risk map for VEI = 3 and VEI = 4
Figure 13 in: Alberico, I., Lirer, L., Petrosino, P., & Scandone, R. (2008). Volcanic hazard and risk assessment from pyroclastic flows at Ischia island (southern Italy). Journal of volcanology and geothermal research, 171(1-2), 118-136.
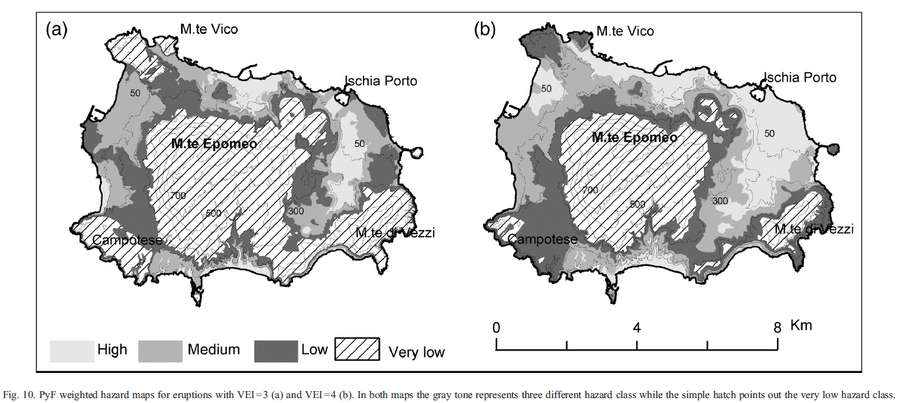
Figure in a journal article
PyF weighted hazard maps for eruptions with VEI=3 and VEI=4
Figure 10 in: Alberico, I., Lirer, L., Petrosino, P., & Scandone, R. (2008). Volcanic hazard and risk assessment from pyroclastic flows at Ischia island (southern Italy). Journal of volcanology and geothermal research, 171(1-2), 118-136.
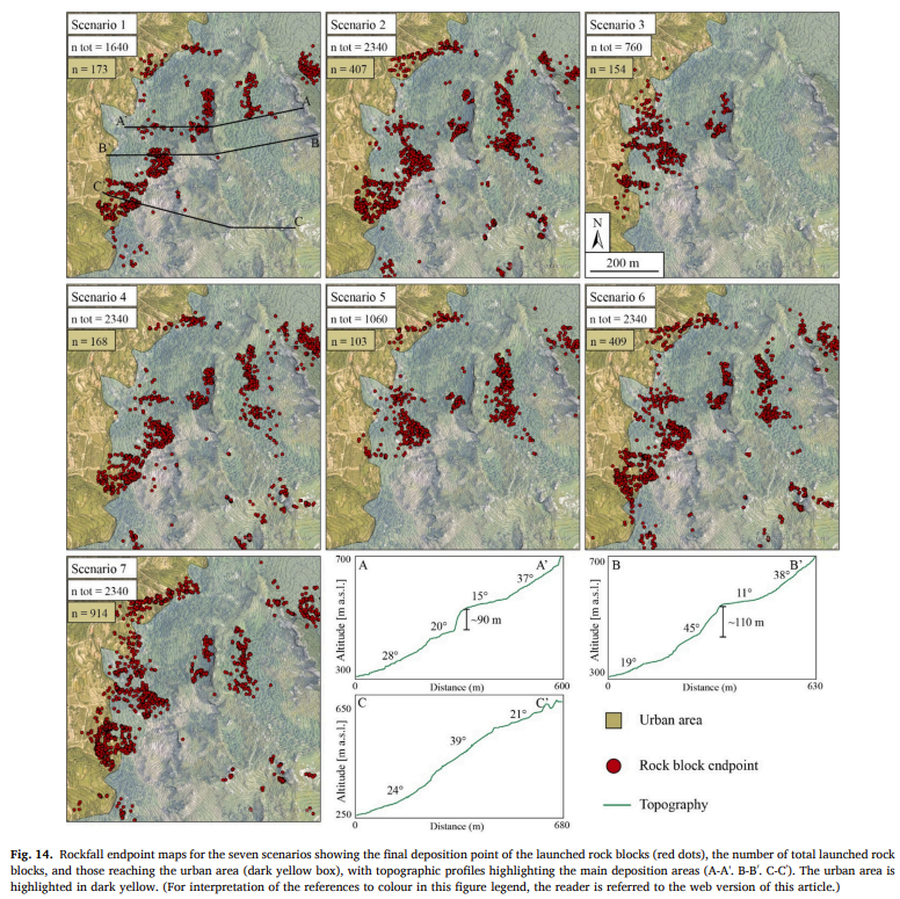
Figure in a journal article
Rockfall endpoint maps for the seven scenarios showing the final deposition point of the launched rock blocks (red dots), the number of total launched rock blocks, and those reaching the urban area (dark yellow box), with topographic profiles highlighting the main deposition areas (A-A'. B-B′. C-C′)
Figure 14 in: Massaro, L., Falcone, G., Coppa, L., Inverso, A., d'Onofrio, A., & Urciuoli, G. (2026). Seismically induced rockfall modelling using a 3D integrated approach: Ischia Island (Italy) case study. Engineering Geology, 108881.
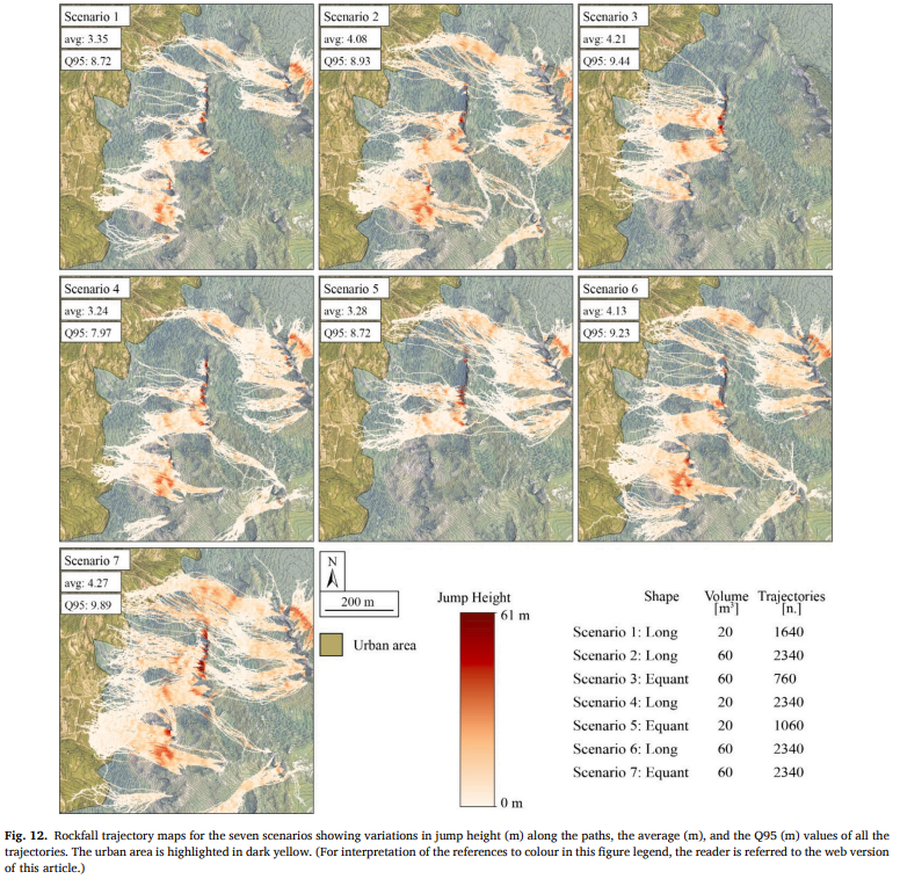
Figure in a journal article
Rockfall trajectory maps for the seven scenarios showing variations in jump height (m) along the paths, the average (m), and the Q95 (m) values of all the trajectories
Figure 12 in: Massaro, L., Falcone, G., Coppa, L., Inverso, A., d'Onofrio, A., & Urciuoli, G. (2026). Seismically induced rockfall modelling using a 3D integrated approach: Ischia Island (Italy) case study. Engineering Geology, 108881.
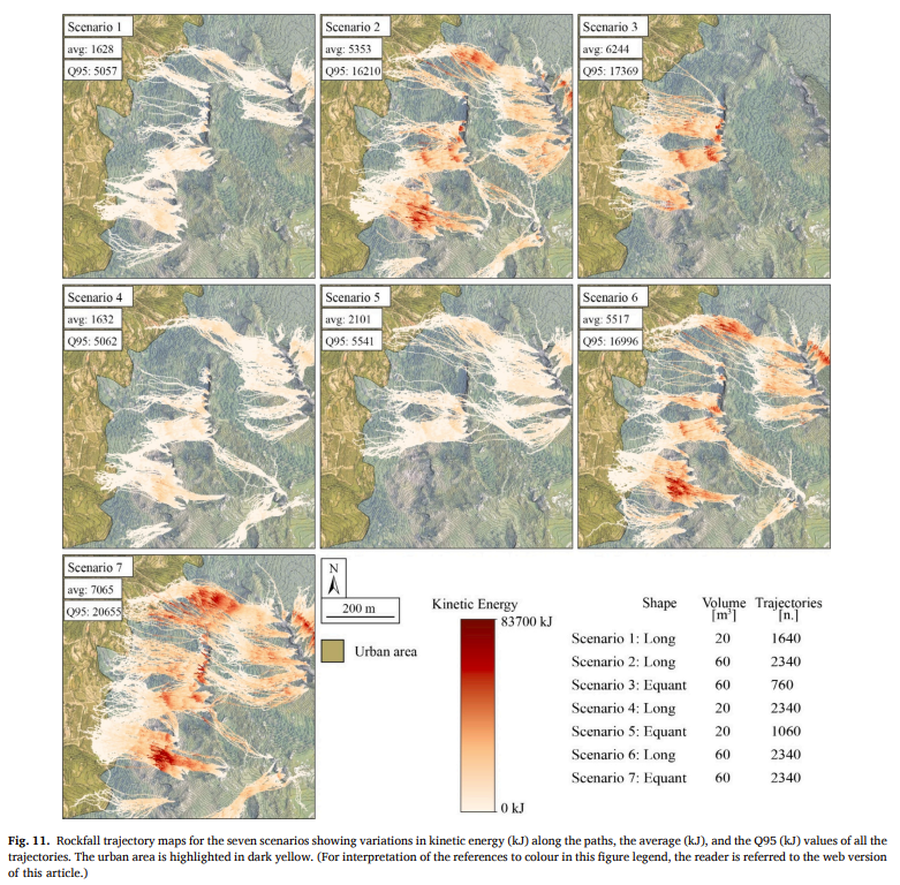
Figure in a journal article
Rockfall trajectory maps for the seven scenarios showing variations in kinetic energy (kJ) along the paths, the average (kJ), and the Q95 (kJ) values of all the trajectories.
Figure 11 in: Massaro, L., Falcone, G., Coppa, L., Inverso, A., d'Onofrio, A., & Urciuoli, G. (2026). Seismically induced rockfall modelling using a 3D integrated approach: Ischia Island (Italy) case study. Engineering Geology, 108881.
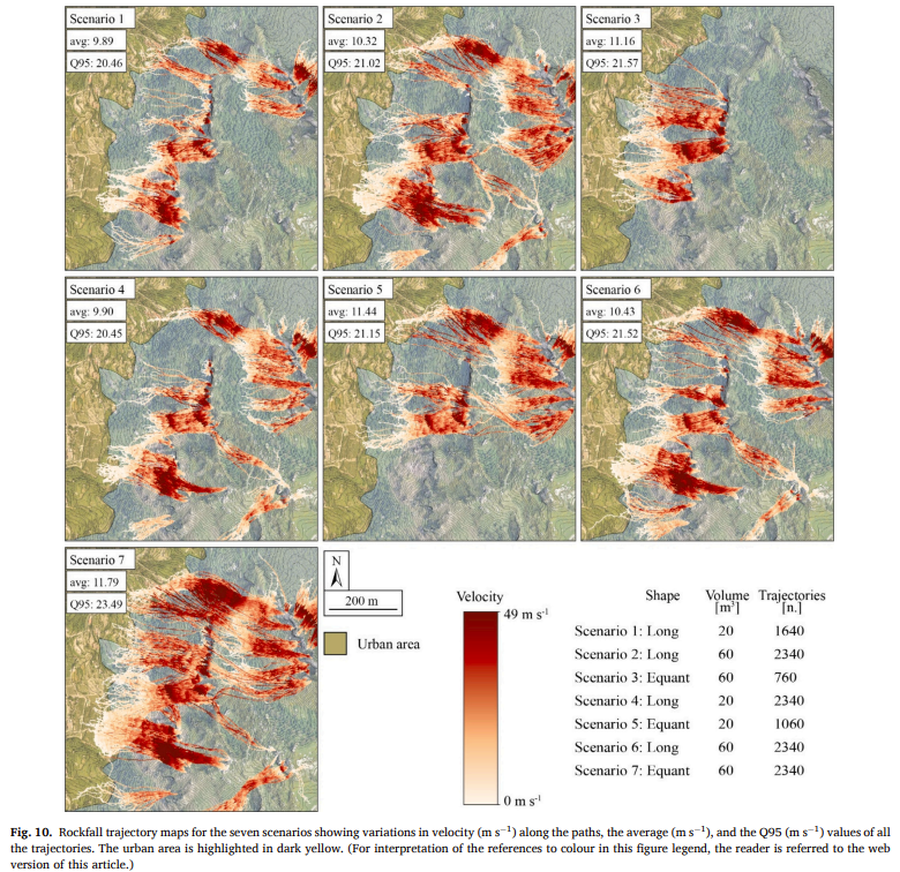
Figure in a journal article
Rockfall trajectory maps for the seven scenarios showing variations in velocity (ms^-1) along the paths, the average (ms^-1), and the Q95 (ms^-1) values of all the trajectories.
Figure 10 in: Massaro, L., Falcone, G., Coppa, L., Inverso, A., d'Onofrio, A., & Urciuoli, G. (2026). Seismically induced rockfall modelling using a 3D integrated approach: Ischia Island (Italy) case study. Engineering Geology, 108881.
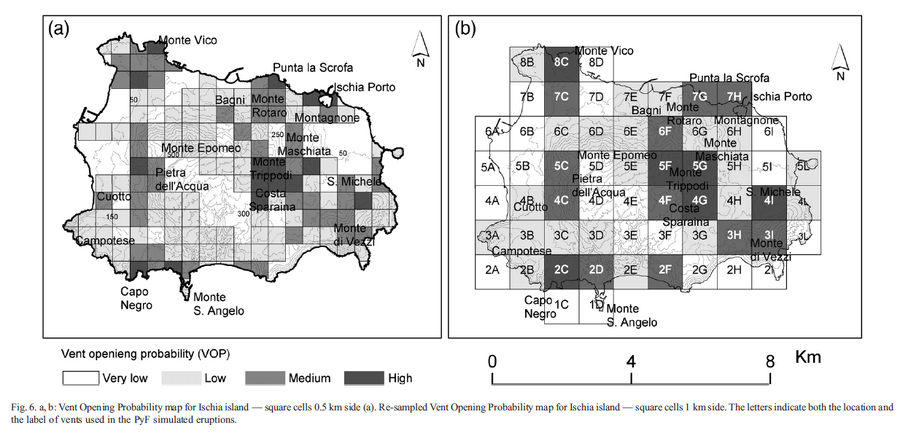
Figure in a journal article
Vent Opening Probability map for Ischia island
Figure 6 in: Alberico, I., Lirer, L., Petrosino, P., & Scandone, R. (2008). Volcanic hazard and risk assessment from pyroclastic flows at Ischia island (southern Italy). Journal of volcanology and geothermal research, 171(1-2), 118-136.
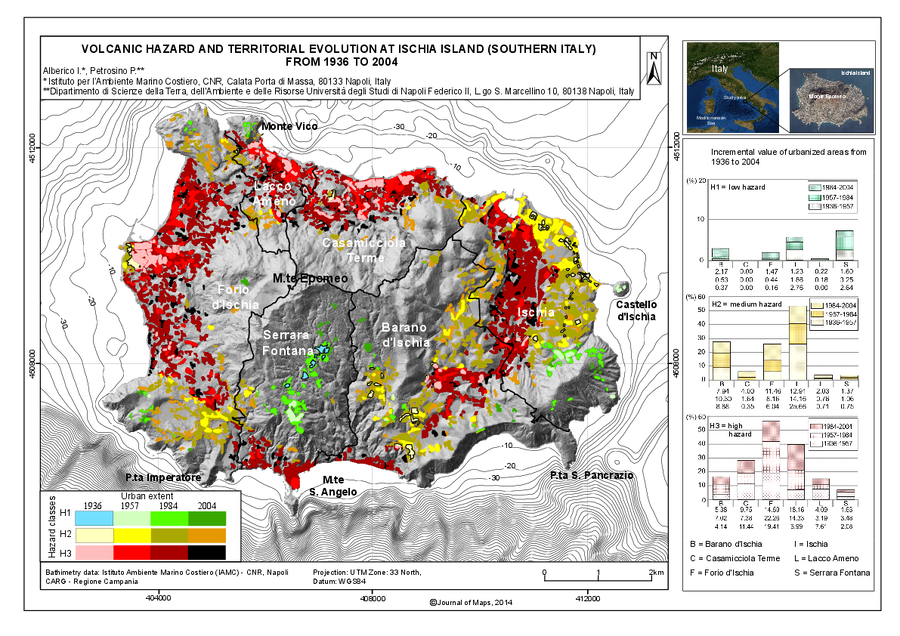
Figure in a journal article
Volcanic hazard and territorial evolution at Ischia Island (Southern Italy) from 1936 to 2004
Supplemental material in: Alberico, I., & Petrosino, P. (2014). Territorial evolution and volcanic hazard, Ischia island (southern Italy). Journal of Maps, 10(2), 238-248.
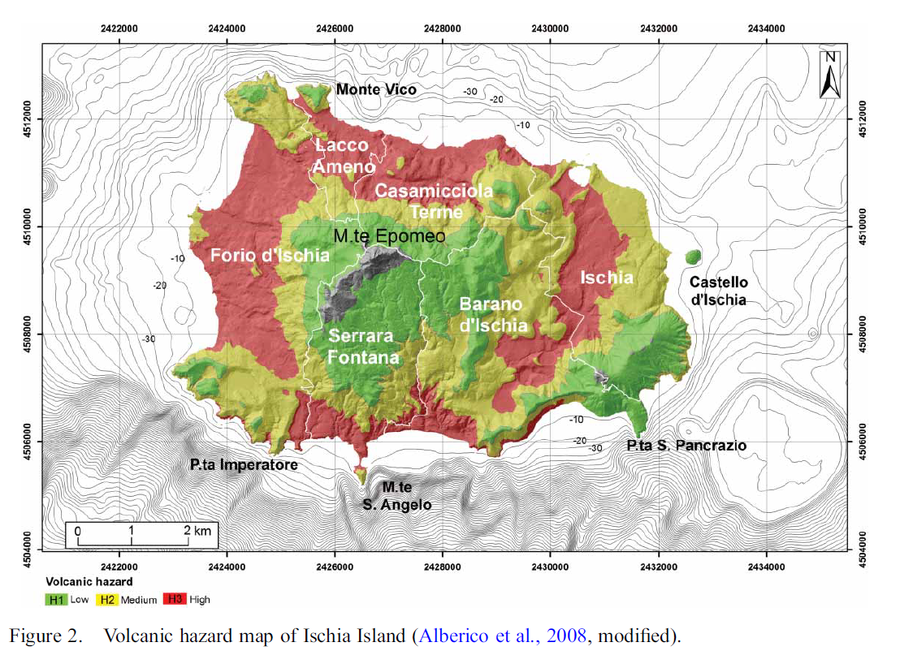
Figure in a journal article
Volcanic hazard map of Ischia Island
Figure 2 in: Alberico, I., & Petrosino, P. (2014). Territorial evolution and volcanic hazard, Ischia island (southern Italy). Journal of Maps, 10(2), 238-248. (Modified from Alberico et al. 2008)