
Advanced Search for Maps
Showing 1-10 of 15
Official, Figure in hazard assessment
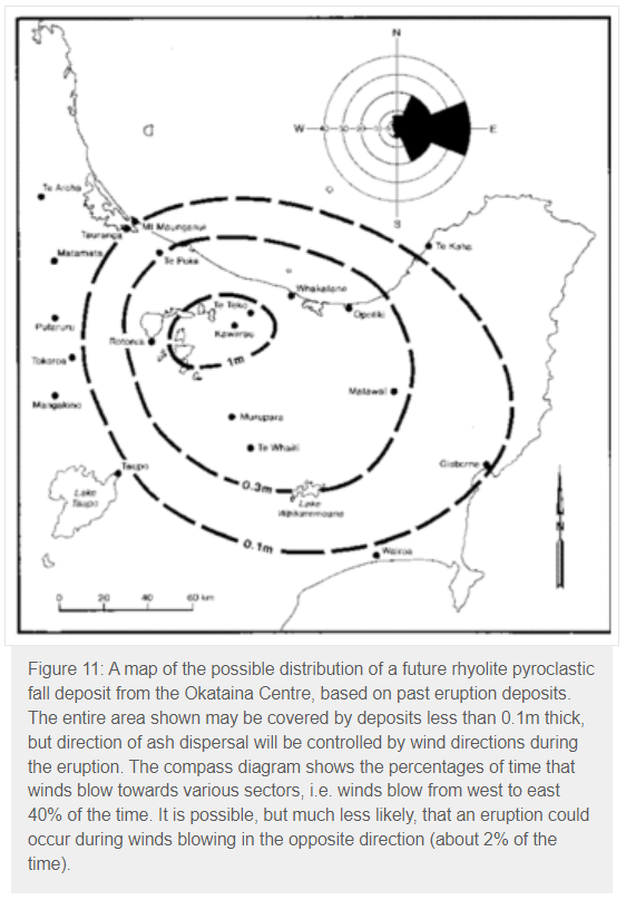
A map of the possible distribution of a future rhyolite pyroclastic fall deposit from the Okataina Centre, based on past eruption deposits
Figure 11 in: Nairn, I.A. (1993). Volcanic hazards at Okataina Centre. 3rd ed. Ministry of Civil Defence, Palmerston North, NZ. Volcanic hazards information series 2. 29 p. Reproduced on website: https://www.gns.cri.nz/Home/Learning/Science-Topics/Volcanoes/New-Zealand-Volcanoes/Volcano-Geology-and-Hazards/Okataina-Volcanic-Centre-Geology
Official, Figure in a journal article
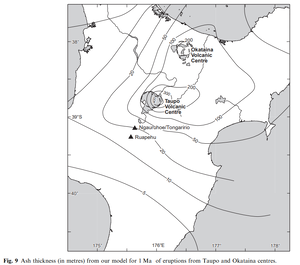
Ash thickness (in metres) from our model for 1 Ma of eruptions from Taupo and Okataina centres
Figure 9 in: Hurst, T. & Smith, W. (2010). Volcanic ashfall in New Zealand–probabilistic hazard modelling for multiple sources. New Zealand Journal of Geology and Geophysics, 53(1), 1-14. https://doi.org/10.1080/00288301003631129
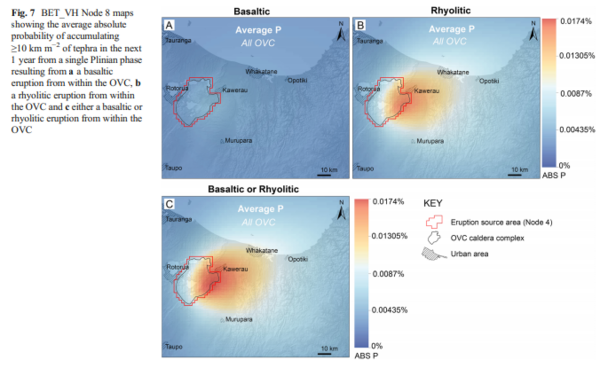
Figure in a journal article
BET_VH Node 8 maps showing the average absolute probability of accumulating ≥10 km m−2 of tephra in the next 1 year from a single Plinian phase resulting from a a basaltic eruption from within the OVC, b a rhyolitic eruption from within the OVC and c either a basaltic or rhyolitic eruption from within the OVC
Figure 7 in: Thompson, M. A., Lindsay, J. M., Sandri, L., Biass, S., Bonadonna, C., Jolly, G., & Marzocchi, W. (2015). Exploring the influence of vent location and eruption style on tephra fall hazard from the Okataina Volcanic Centre, New Zealand. Bulletin of volcanology, 77(5), 38. https://doi.org/10.1007/s00445-015-0926-y
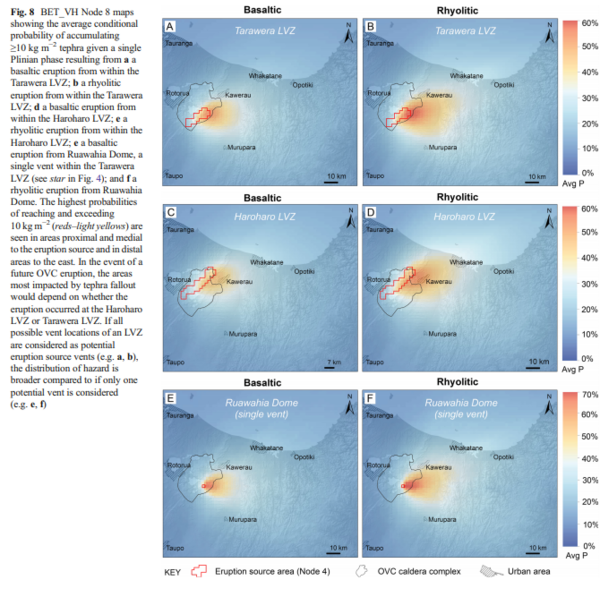
Figure in a journal article
BET_VH Node 8 maps showing the average conditional probability of accumulating ≥10 kg m−2 tephra given a single Plinian phase resulting from a a basaltic eruption from within the Tarawera LVZ; b a rhyolitic eruption from within the Tarawera LVZ; d a basaltic eruption from within the Haroharo LVZ; e a rhyolitic eruption from within the Haroharo LVZ; e a basaltic eruption from Ruawahia Dome, a single vent within the Tarawera LVZ (see star in Fig. 4); and f a rhyolitic eruption from Ruawahia Dome
Figure 8 in: Thompson, M. A., Lindsay, J. M., Sandri, L., Biass, S., Bonadonna, C., Jolly, G., & Marzocchi, W. (2015). Exploring the influence of vent location and eruption style on tephra fall hazard from the Okataina Volcanic Centre, New Zealand. Bulletin of volcanology, 77(5), 38. https://doi.org/10.1007/s00445-015-0926-y
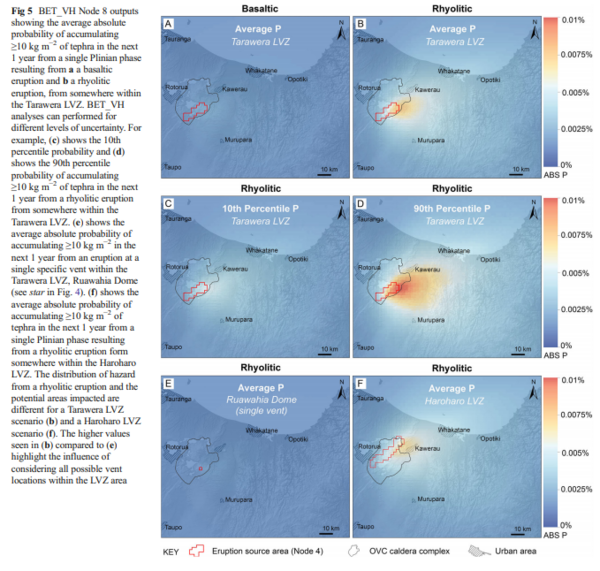
Figure in a journal article
BET_VH Node 8 outputs showing the average absolute probability of accumulating ≥10 kg m−2 of tephra in the next 1 year from a single Plinian phase resulting from a a basaltic eruption and b a rhyolitic eruption, from somewhere within the Tarawera LVZ
Figure 5 in: Thompson, M. A., Lindsay, J. M., Sandri, L., Biass, S., Bonadonna, C., Jolly, G., & Marzocchi, W. (2015). Exploring the influence of vent location and eruption style on tephra fall hazard from the Okataina Volcanic Centre, New Zealand. Bulletin of volcanology, 77(5), 38. https://doi.org/10.1007/s00445-015-0926-y
Official, Figure in hazard assessment
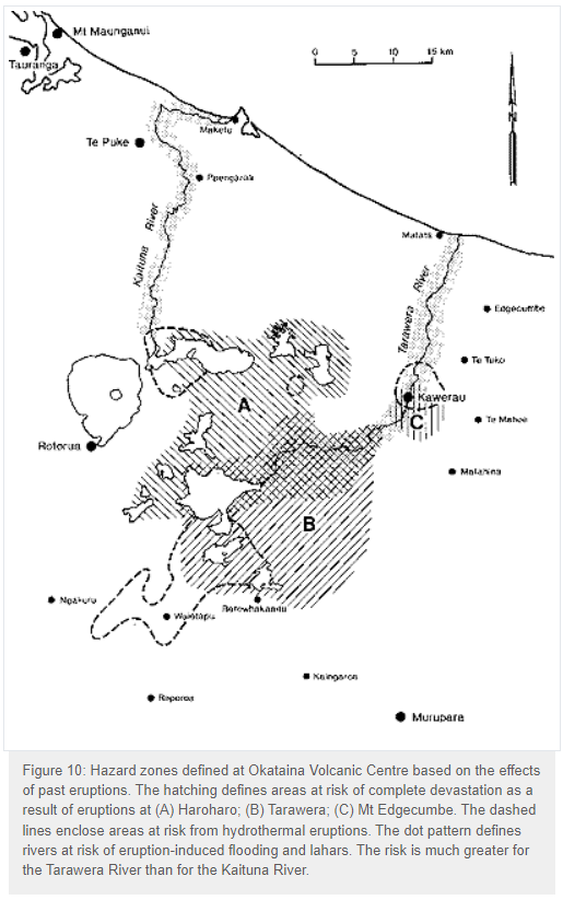
Hazard zones defined at Okataina Volcanic Centre based on the effects of past eruptions
Figure 10 in: Nairn, I.A. (1993). Volcanic hazards at Okataina Centre. 3rd ed. Ministry of Civil Defence, Palmerston North, NZ. Volcanic hazards information series 2. 29 p. Reproduced on website: https://www.gns.cri.nz/Home/Learning/Science-Topics/Volcanoes/New-Zealand-Volcanoes/Volcano-Geology-and-Hazards/Okataina-Volcanic-Centre-Geology
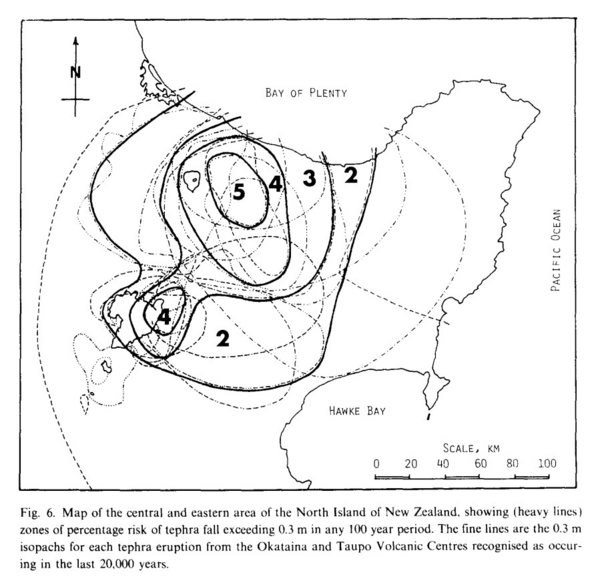
Figure in a journal article
Map of the central and eastern area of the North Island of New Zealand, showing (heavy lines) zones of percentage risk of tephra fall exceeding 0.3 m in any 100 year period
Figure 6 in: Dibble, R.R., Nairn, I.A., & Neall, V.E. (1985). Volcanic hazards of North Island, New Zealand--Overview. Journal of Geodynamics, 3, p. 369-396. https://doi.org/10.1016/0264-3707(85)90043-2
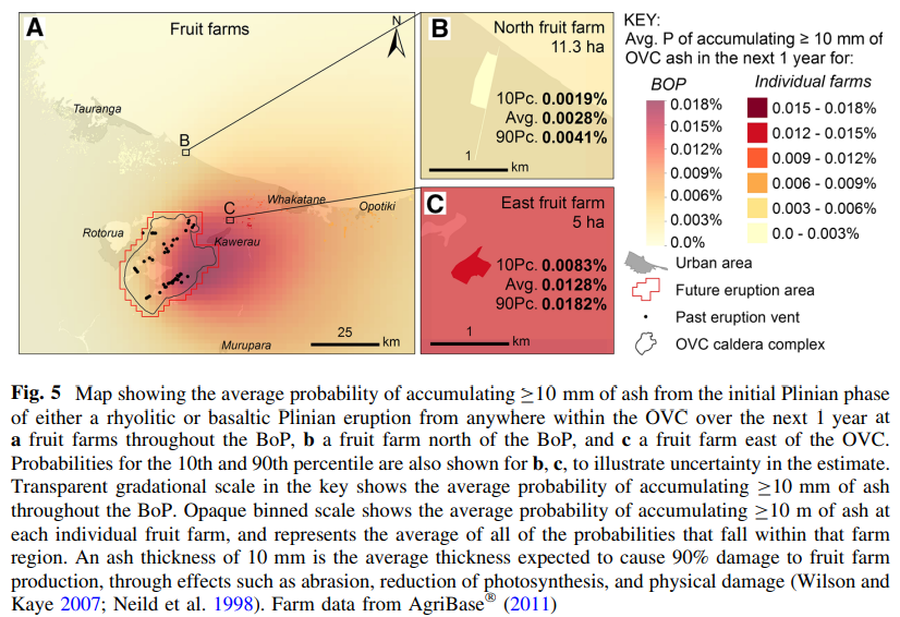
Figure in a journal article
Map showing the average probability of accumulating C10 mm of ash from the initial Plinian phase of either a rhyolitic or basaltic Plinian eruption from anywhere within the OVC over the next 1 year
Figure 5 in: Thompson, M. A., Lindsay, J. M., Wilson, T. M., Biass, S., & Sandri, L. (2017). Quantifying risk to agriculture from volcanic ashfall: a case study from the Bay of Plenty, New Zealand. Natural Hazards, 86(1), 31-56. https://doi.org/10.1007/s11069-016-2672-7
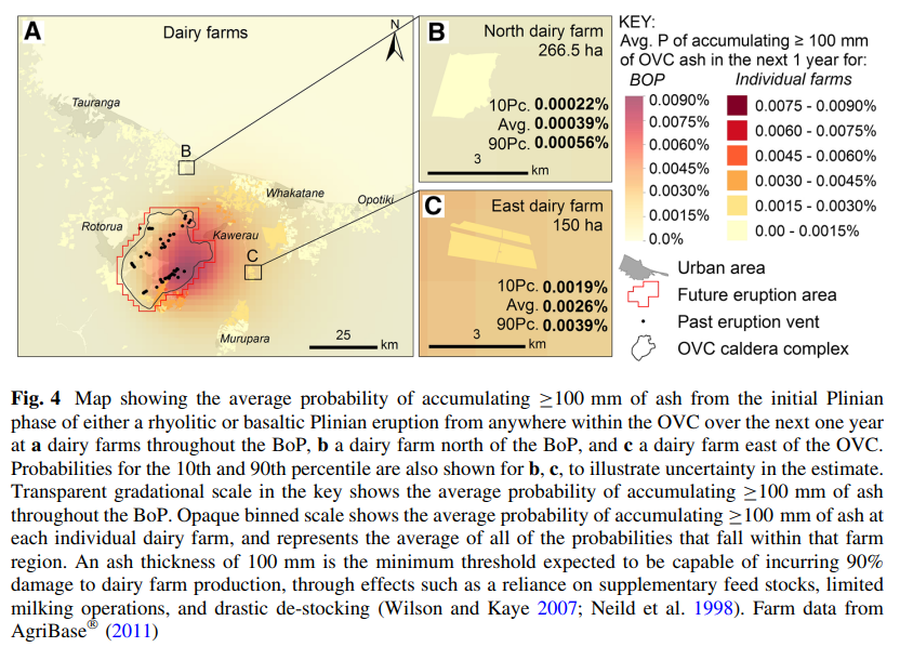
Figure in a journal article
Map showing the average probability of accumulating ≥100 mm of ash from the initial Plinian phase of either a rhyolitic or basaltic Plinian eruption from anywhere within the OVC over the next one year
Figure 4 in: Thompson, M. A., Lindsay, J. M., Wilson, T. M., Biass, S., & Sandri, L. (2017). Quantifying risk to agriculture from volcanic ashfall: a case study from the Bay of Plenty, New Zealand. Natural Hazards, 86(1), 31-56. https://doi.org/10.1007/s11069-016-2672-7
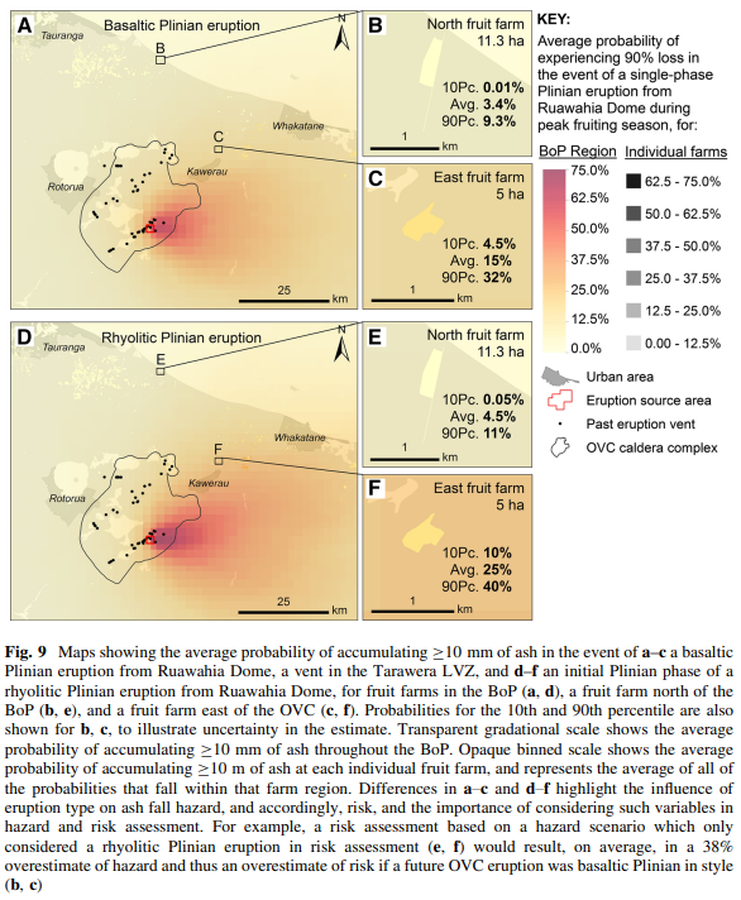
Figure in a journal article
Maps showing the average probability of accumulating ≥10 mm of ash in the event of a–c a basaltic Plinian eruption from Ruawahia Dome, a vent in the Tarawera LVZ, and d–f an initial Plinian phase of a rhyolitic Plinian eruption from Ruawahia Dome, for fruit farms in the BoP
Figure 9 in: Thompson, M. A., Lindsay, J. M., Wilson, T. M., Biass, S., & Sandri, L. (2017). Quantifying risk to agriculture from volcanic ashfall: a case study from the Bay of Plenty, New Zealand. Natural Hazards, 86(1), 31-56. https://doi.org/10.1007/s11069-016-2672-7
Page: 1 2