
Advanced Search for Maps
Showing 1-4 of 4
Official, Figure in a journal article
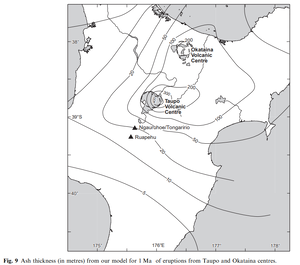
Ash thickness (in metres) from our model for 1 Ma of eruptions from Taupo and Okataina centres
Figure 9 in: Hurst, T. & Smith, W. (2010). Volcanic ashfall in New Zealand–probabilistic hazard modelling for multiple sources. New Zealand Journal of Geology and Geophysics, 53(1), 1-14. https://doi.org/10.1080/00288301003631129
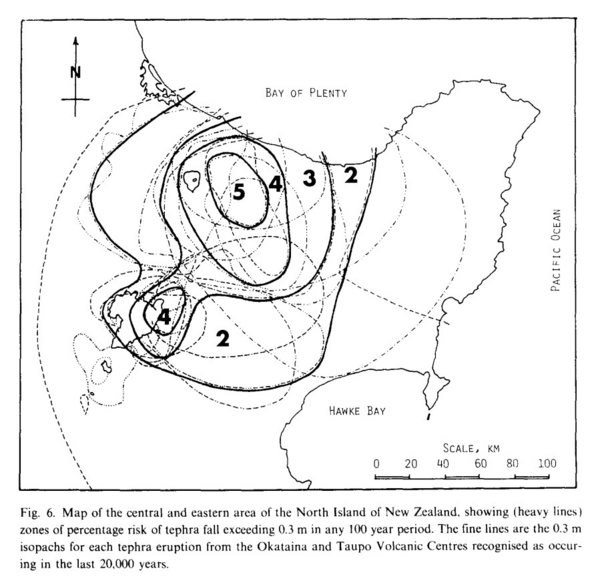
Figure in a journal article
Map of the central and eastern area of the North Island of New Zealand, showing (heavy lines) zones of percentage risk of tephra fall exceeding 0.3 m in any 100 year period
Figure 6 in: Dibble, R.R., Nairn, I.A., & Neall, V.E. (1985). Volcanic hazards of North Island, New Zealand--Overview. Journal of Geodynamics, 3, p. 369-396. https://doi.org/10.1016/0264-3707(85)90043-2
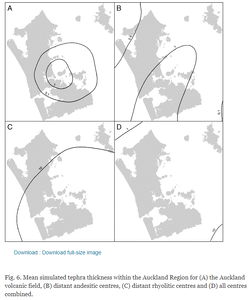
Figure in a journal article
Mean simulated tephra thickness within the Auckland Region
Figure 6 in: Magill, C. R., Hurst, A. W., Hunter, L. J., & Blong, R. J. (2006). Probabilistic tephra fall simulation for the Auckland Region, New Zealand. Journal of volcanology and geothermal research, 153(3-4), 370-386. https://doi.org/10.1016/j.jvolgeores.2005.12.002
Official, Figure in a journal article
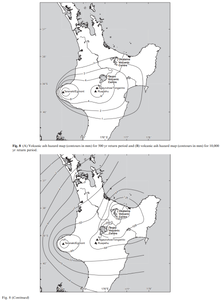
Volcanic ash hazard map (contours in mm) for 500 yr return period and volcanic ash hazard map (contours in mm) for 10,000 yr return period
Figure 8 in: Hurst, T. & Smith, W. (2010). Volcanic ashfall in New Zealand–probabilistic hazard modelling for multiple sources. New Zealand Journal of Geology and Geophysics, 53(1), 1-14. https://doi.org/10.1080/00288301003631129