
Advanced Search for Maps
Showing 1-2 of 2
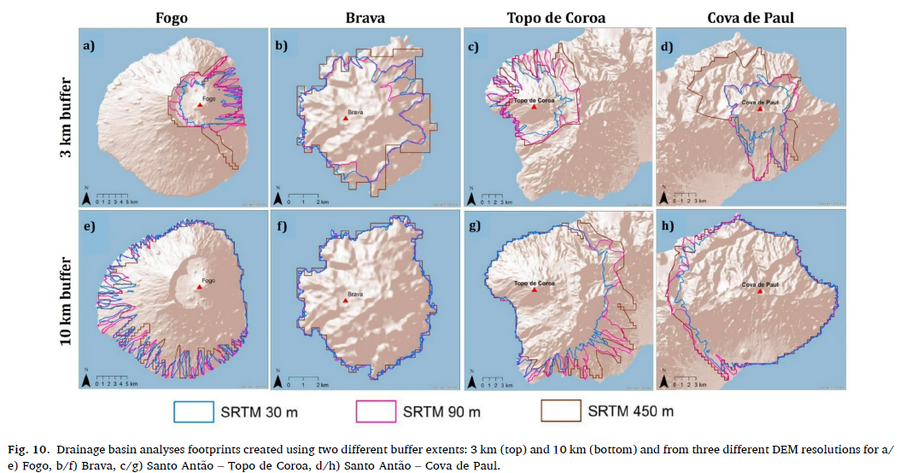
Figure in a journal article
Drainage basin analyses footprints created using two different buffer extents: 3 km (top) and 10 km (bottom) and from three different DEM resolutions for a/e) Fogo, b/f) Brava, c/g) Santo Antão – Topo de Coroa, d/h) Santo Antão – Cova de Paul
Figure 10 in: Jenkins, S. F., Mee, K., Engwell, S. L., Loughlin, S. C., Faria, B. V. E., Yirgu, G., ... & Crummy, J. (2024). Assessing volcanic hazard and exposure in a data poor context: Case study for Ethiopia, Kenya, and Cabo Verde. Progress in Disaster Science, 23, 100350.
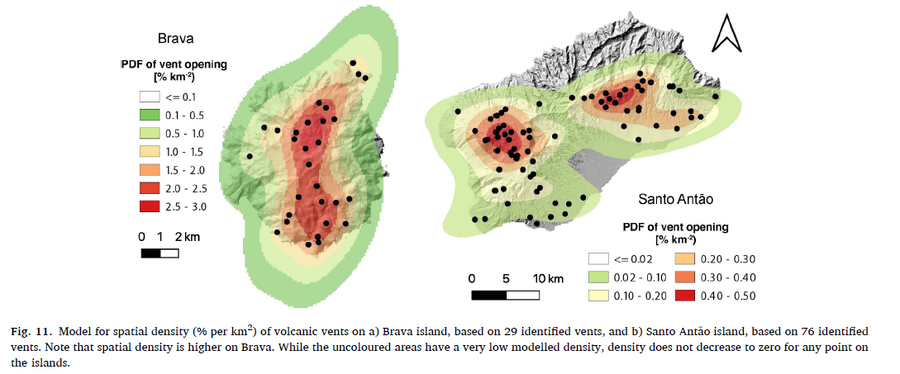
Figure in a journal article
Model for spatial density (% per km2) of volcanic vents on a) Brava island, based on 29 identified vents, and b) Santo Antão island, based on 76 identified vents
Figure 11 in: Jenkins, S. F., Mee, K., Engwell, S. L., Loughlin, S. C., Faria, B. V. E., Yirgu, G., ... & Crummy, J. (2024). Assessing volcanic hazard and exposure in a data poor context: Case study for Ethiopia, Kenya, and Cabo Verde. Progress in Disaster Science, 23, 100350.