
Advanced Search for Maps
Showing 1-10 of 11
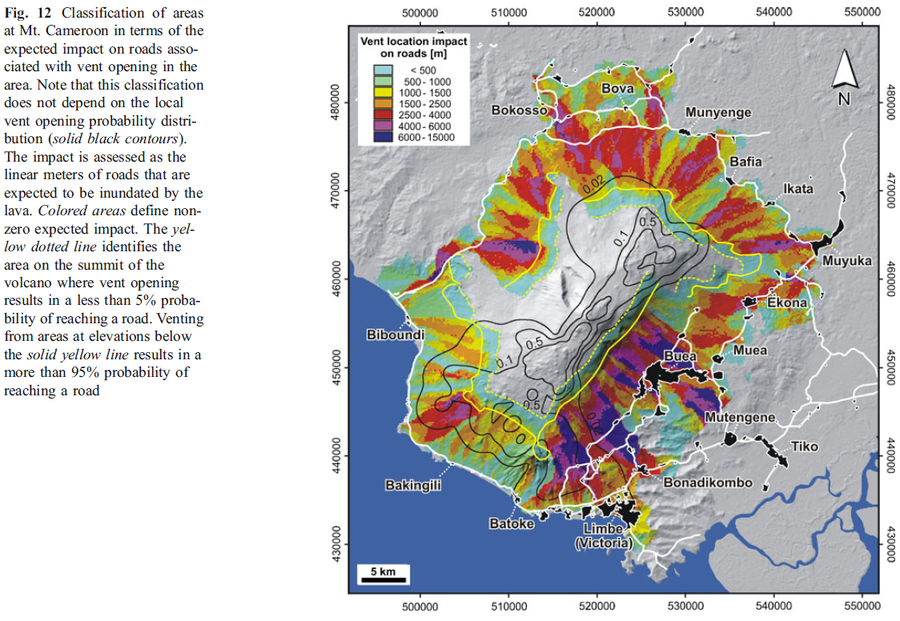
Figure in a journal article
Classification of areas at Mt. Cameroon in terms of the expected impact on roads associated with vent opening in the area
Figure 12 in: Favalli, M., Tarquini, S., Papale, P., Fornaciai, A., & Boschi, E. (2012). Lava flow hazard and risk at Mt. Cameroon volcano. Bulletin of Volcanology, 74(2), 423-439. https://doi.org/10.1007/s00445-011-0540-6
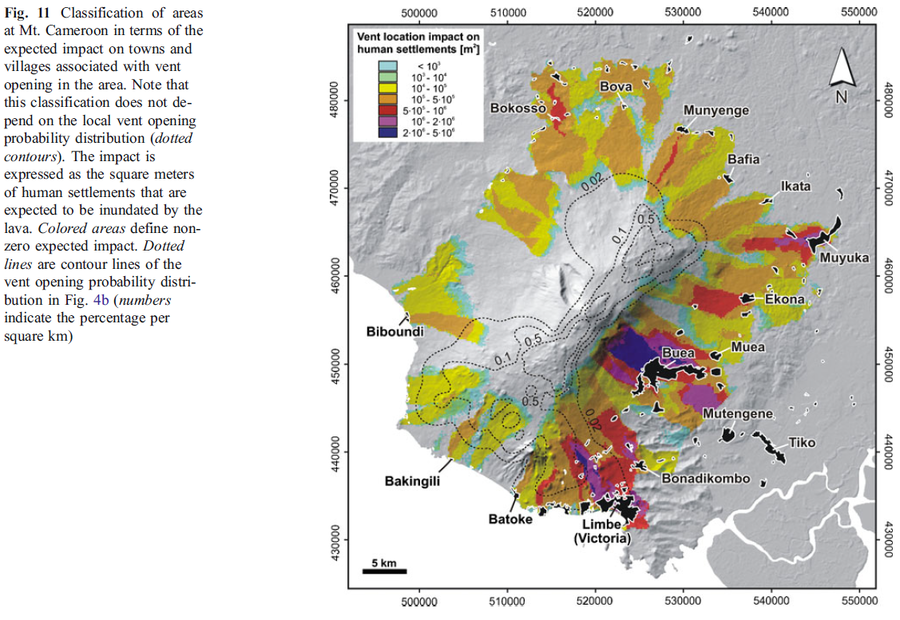
Figure in a journal article
Classification of areas at Mt. Cameroon in terms of the expected impact on towns and villages associated with vent opening in the area
Figure 11 in: Favalli, M., Tarquini, S., Papale, P., Fornaciai, A., & Boschi, E. (2012). Lava flow hazard and risk at Mt. Cameroon volcano. Bulletin of Volcanology, 74(2), 423-439. https://doi.org/10.1007/s00445-011-0540-6
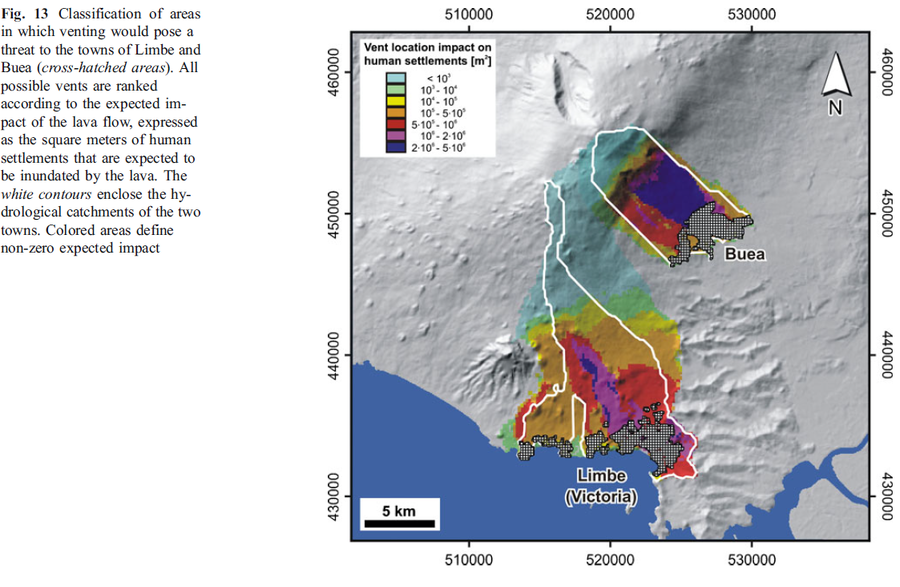
Figure in a journal article
Classification of areas in which venting would pose a threat to the towns of Limbe and Buea
Figure 13 in: Favalli, M., Tarquini, S., Papale, P., Fornaciai, A., & Boschi, E. (2012). Lava flow hazard and risk at Mt. Cameroon volcano. Bulletin of Volcanology, 74(2), 423-439. https://doi.org/10.1007/s00445-011-0540-6
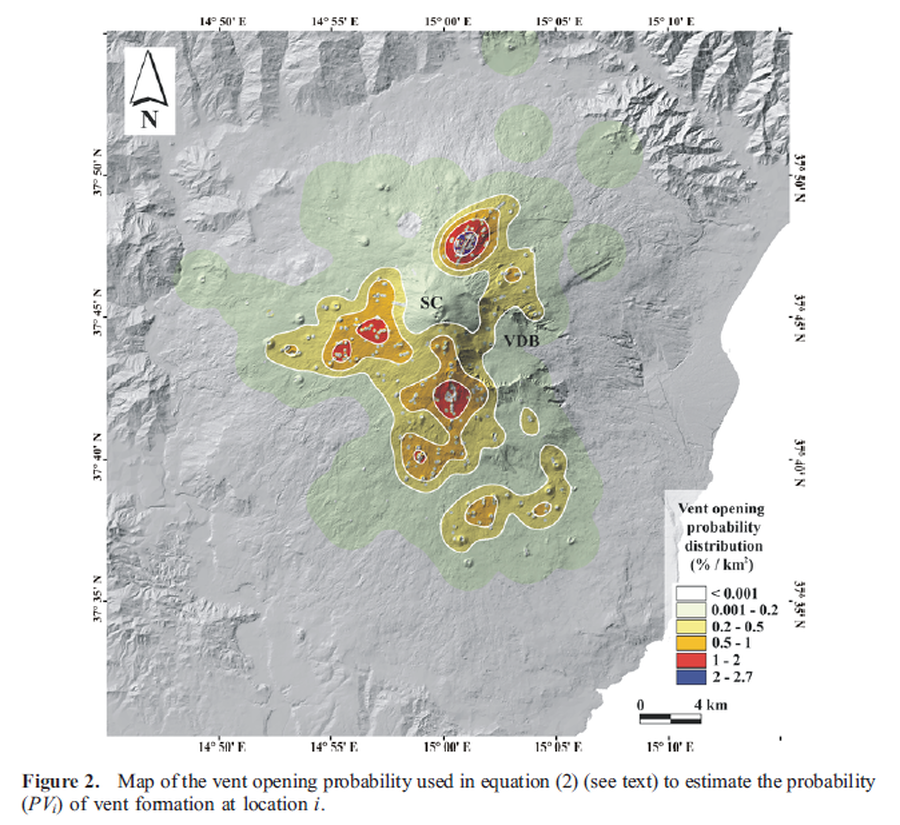
Figure in a journal article
Map of the vent opening probability
Figure 2 in: Favalli, M., Mazzarini, F., Pareschi, M. T., & Boschi, E. (2009). Topographic control on lava flow paths at Mount Etna, Italy: implications for hazard assessment. Journal of Geophysical Research: Earth Surface, 114(F1). https://doi.org/10.1029/2007JF000918
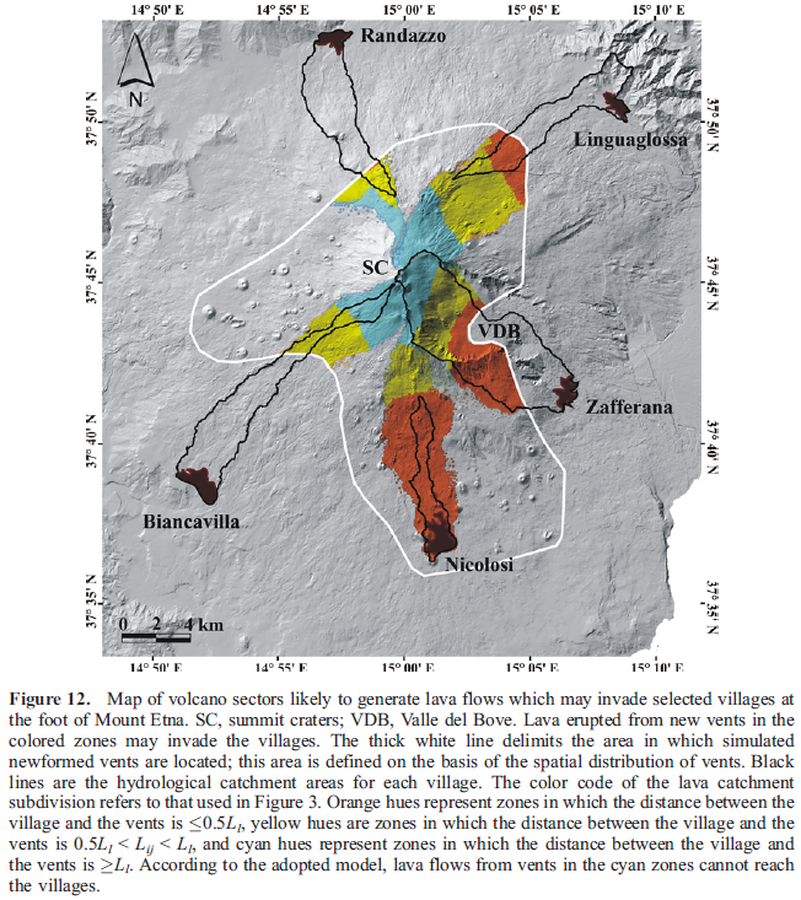
Figure in a journal article
Map of volcano sectors likely to generate lava flows which may invade selected villages at the foot of Mount Etna. SC, summit craters; VDB, Valle del Bove
Figure 12 in: Favalli, M., Mazzarini, F., Pareschi, M. T., & Boschi, E. (2009). Topographic control on lava flow paths at Mount Etna, Italy: implications for hazard assessment. Journal of Geophysical Research: Earth Surface, 114(F1). https://doi.org/10.1029/2007JF000918
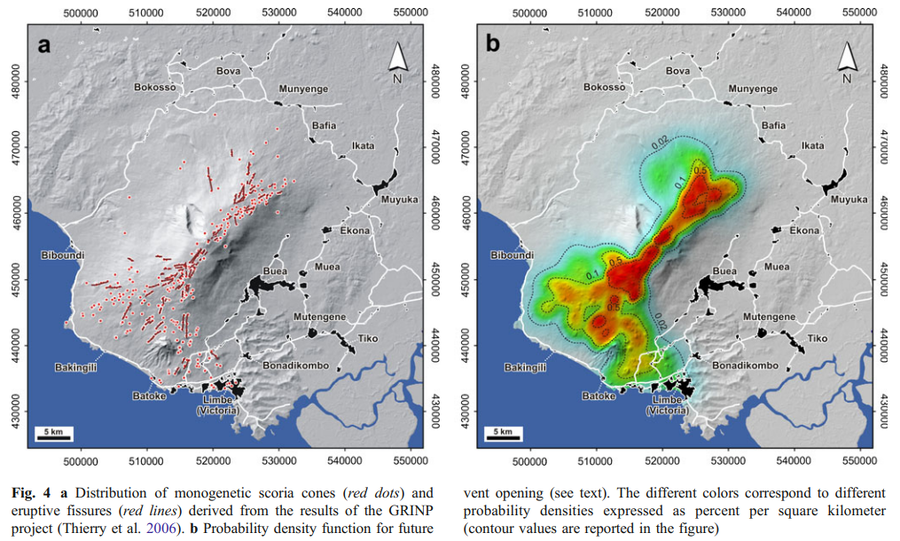
Figure in a journal article
Probability density function for future vent opening.
Figure 4 in: Favalli, M., Tarquini, S., Papale, P., Fornaciai, A., & Boschi, E. (2012). Lava flow hazard and risk at Mt. Cameroon volcano. Bulletin of Volcanology, 74(2), 423-439. https://doi.org/10.1007/s00445-011-0540-6
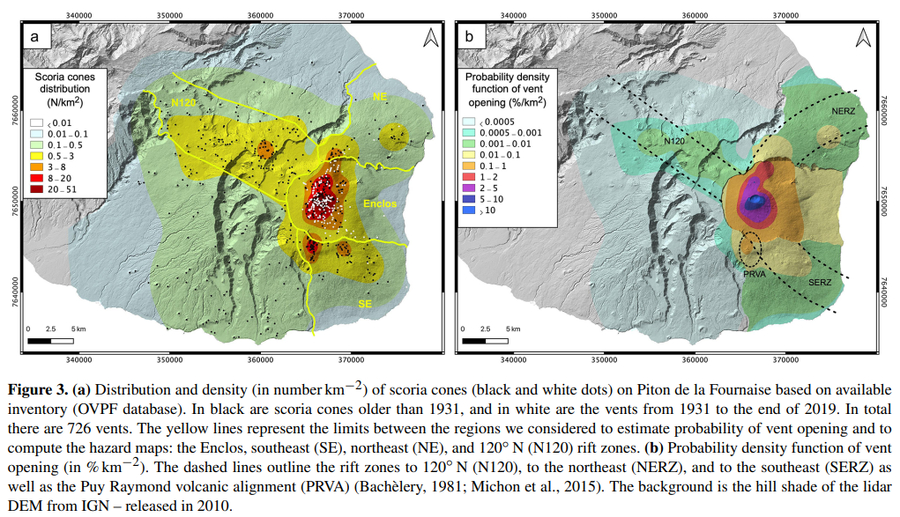
Figure in a journal article
Probability density function of vent opening (in % km−2)
Figure 3 in: Chevrel, M. O., Favalli, M., Villeneuve, N., Harris, A. J., Fornaciai, A., Richter, N., Derrien, A., Di Muro, A., & Peltier, A. (2021). Lava flow hazard map of Piton de la Fournaise volcano. Natural Hazards and Earth System Sciences, 21(8), 2355-2377. https://doi.org/10.5194/nhess-21-2355-2021, 2021
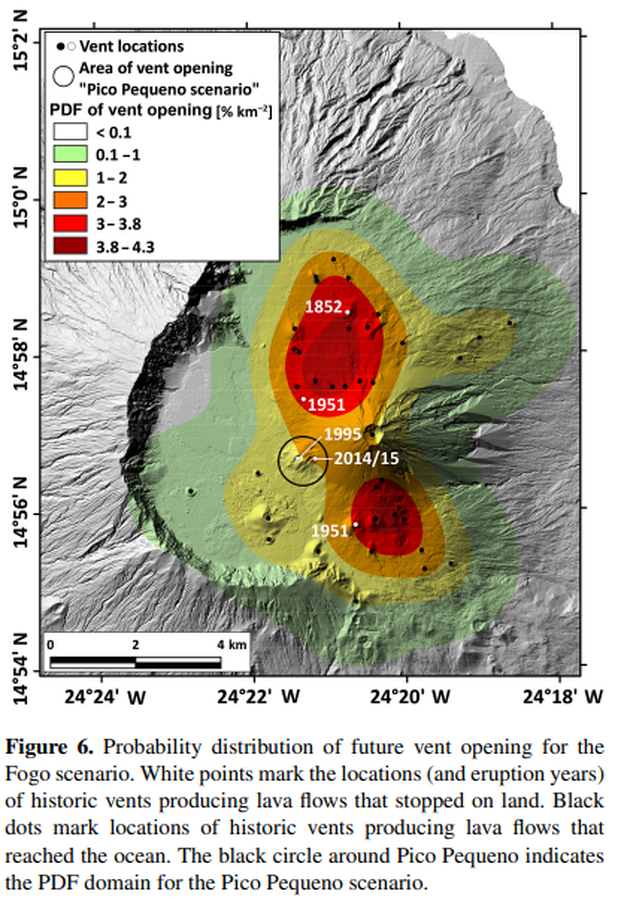
Figure in a journal article
Probability distribution of future vent opening for the Fogo scenario
Figure 6 in: Richter, N., Favalli, M., de Zeeuw-van Dalfsen, E., Fornaciai, A., da Silva Fernandes, R. M., Pérez, N. M., Levy, J., Victoria, S.S., & Walter, T. R. (2016). Lava flow hazard at Fogo Volcano, Cabo Verde, before and after the 2014–2015 eruption. Natural Hazards and Earth System Sciences, 16(8), 1925-1951. https://doi.org/10.5194/nhess-16-1925-2016
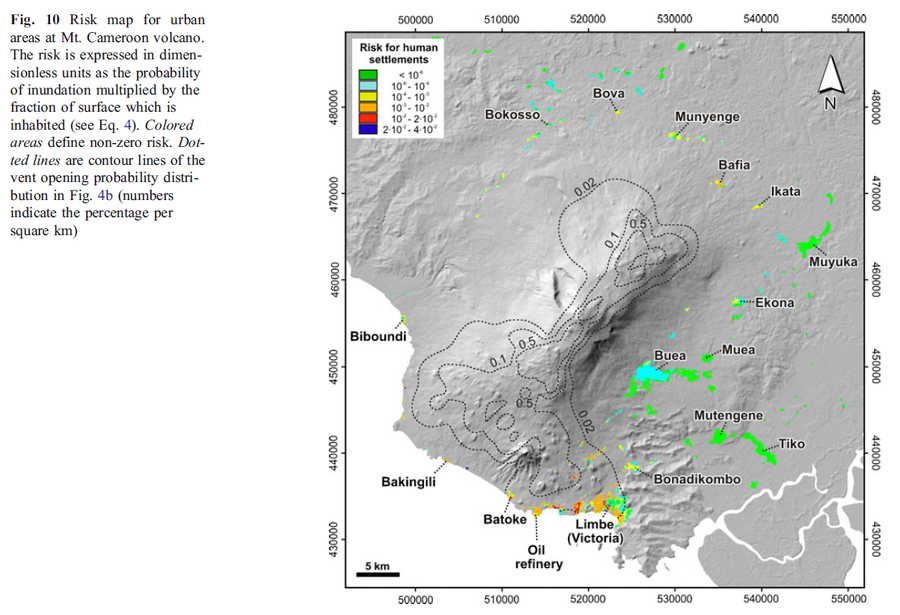
Figure in a journal article
Risk map for urban areas at Mt. Cameroon volcano
Figure 10 in: Favalli, M., Tarquini, S., Papale, P., Fornaciai, A., & Boschi, E. (2012). Lava flow hazard and risk at Mt. Cameroon volcano. Bulletin of Volcanology, 74(2), 423-439. https://doi.org/10.1007/s00445-011-0540-6

Figure in a journal article
Spatiotemporal probability map of vent opening at Mt. Etna for the next 10 years within the summit area
Figure 4 in: Del Negro, C., Cappello, A., Neri, M., Bilotta, G., Hérault, A., & Ganci, G. (2013). Lava flow hazards at Mount Etna: constraints imposed by eruptive history and numerical simulations. Scientific Reports, 3(1). https://doi.org/10.1038/srep03493
Page: 1 2