
Advanced Search for Maps
Showing 11-15 of 15
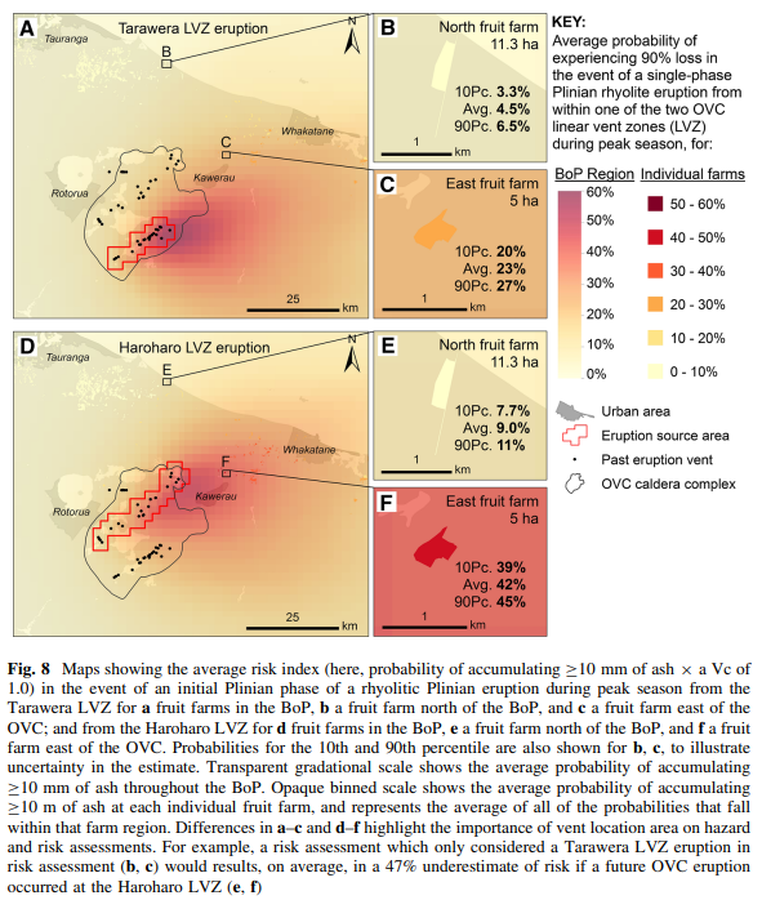
Figure in a journal article
Maps showing the average risk index (here, probability of accumulating ≥10 mm of ash × a Vc of 1.0) in the event of an initial Plinian phase of a rhyolitic Plinian eruption during peak season from the Tarawera LVZ for a fruit farms in the BoP
Figure 8 in: Thompson, M. A., Lindsay, J. M., Wilson, T. M., Biass, S., & Sandri, L. (2017). Quantifying risk to agriculture from volcanic ashfall: a case study from the Bay of Plenty, New Zealand. Natural Hazards, 86(1), 31-56. https://doi.org/10.1007/s11069-016-2672-7
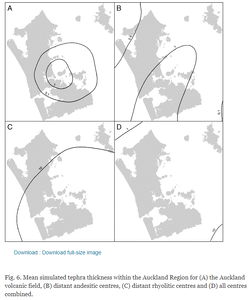
Figure in a journal article
Mean simulated tephra thickness within the Auckland Region
Figure 6 in: Magill, C. R., Hurst, A. W., Hunter, L. J., & Blong, R. J. (2006). Probabilistic tephra fall simulation for the Auckland Region, New Zealand. Journal of volcanology and geothermal research, 153(3-4), 370-386. https://doi.org/10.1016/j.jvolgeores.2005.12.002
Official, Figure in a journal article
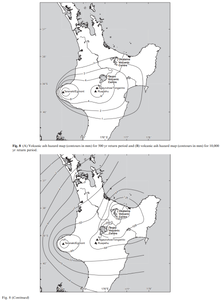
Volcanic ash hazard map (contours in mm) for 500 yr return period and volcanic ash hazard map (contours in mm) for 10,000 yr return period
Figure 8 in: Hurst, T. & Smith, W. (2010). Volcanic ashfall in New Zealand–probabilistic hazard modelling for multiple sources. New Zealand Journal of Geology and Geophysics, 53(1), 1-14. https://doi.org/10.1080/00288301003631129
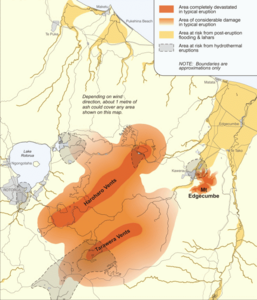
Figure in a journal article
Volcanic hazard map of the Okataina Volcanic Centre
Figure 8 in: Becker, J.S., Saunders, W.S.A., Robertson, C.M., Leonard, G.S., & Johnston, D.M. (2010). A synthesis of challenges and opportunities for reducing volcanic risk through land use planning in New Zealand. The Australasian Journal of Disaster and Trauma Studies, 2010-1. (Simplified from: Nairn, 2002)
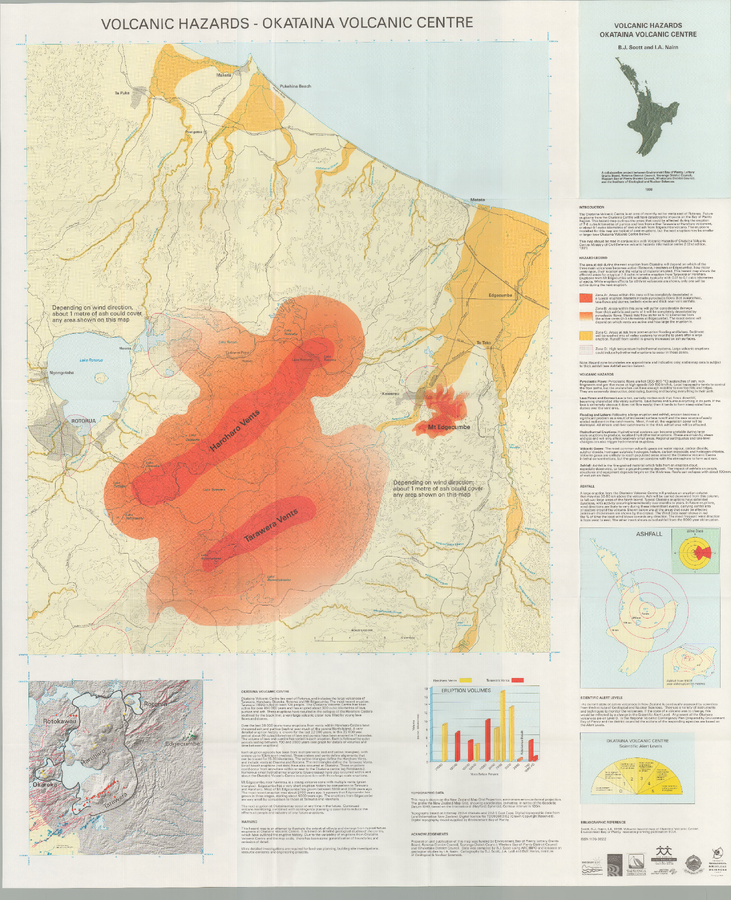
Official, Map sheet or poster
Volcanic Hazards - Okataina Volcanic Centre
Scott, B. J. and Nairn, I. A. (1998). Volcanic hazard map of Okataina Volcanic Centre. Environment Bay of Plenty resource planning publication 97/4.
Page: 1 2