
Advanced Search for Maps
Showing 51-60 of 605
Official, Insert/poster-size map with accompanying report
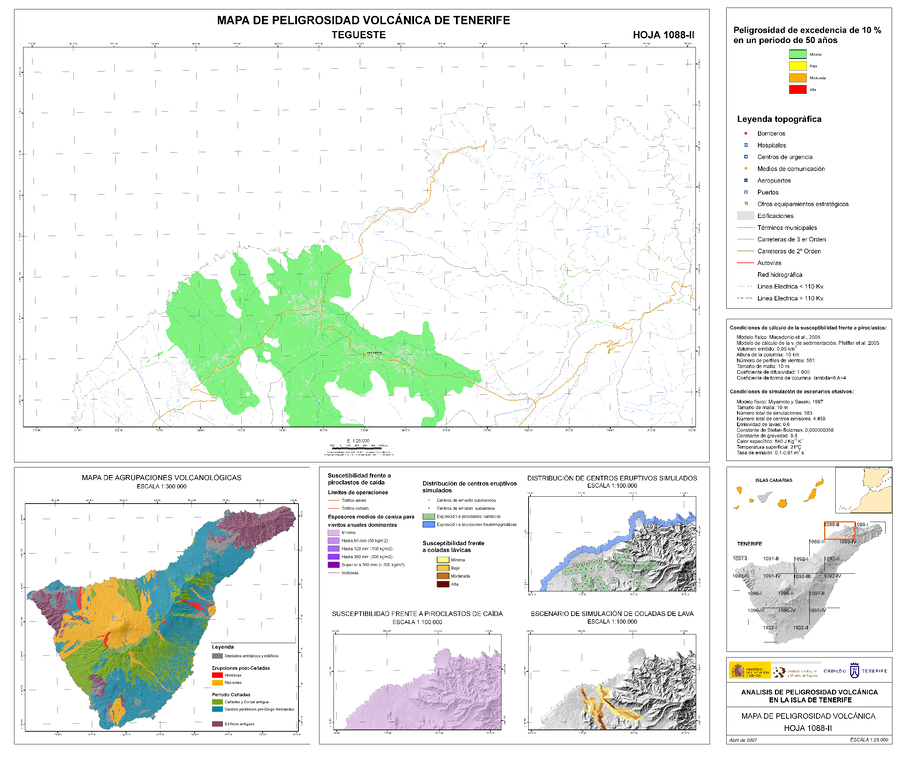
Analisis de Peligrosidad Volcánica en la Isla de Tenerife - Mapa de Peligrosidad Volcánica - Tegueste
(Volcanic Hazard Analysis on the Island of Tenerife - Volcanic Hazard Map - Tegueste)
Sheet 1088-II in: Instituto Geológico y Minero de España (IGME). (2006). Plan Territorial Especial de Ordenación para la Prevención de Riesgos. Documento Cartográfico (Planos de Información - Anexo Cartografía Peligrosidad Volcánica).
Official, Figure in hazard assessment
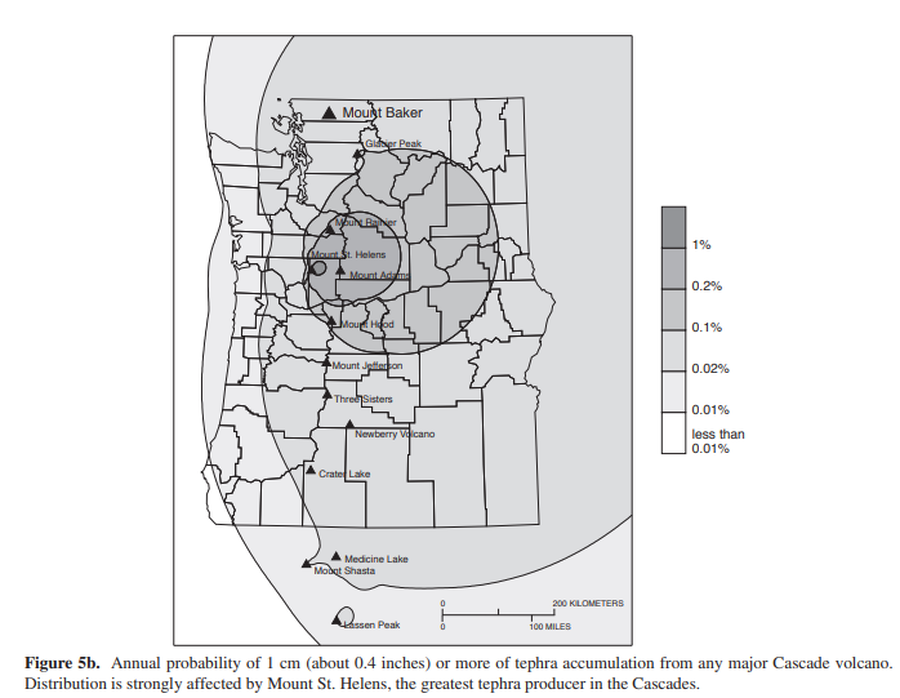
Annual probability of 1 cm (about 0.4 inches) or more of tephra accumulation from any major Cascade volcano
Figure 5b in: Gardner, C.A., Scott, K.M., Miller, C.D., Myers, B., Hildreth, W., & Pringle, P.T. (1995). Potential volcanic hazards from future activity of Mount Baker, Washington. U.S. Geological Survey, Open-File Report 95-498, 16 p., 1 plate, scale 1:100,000. https://doi.org/10.3133/ofr95498
Official, Figure in hazard assessment
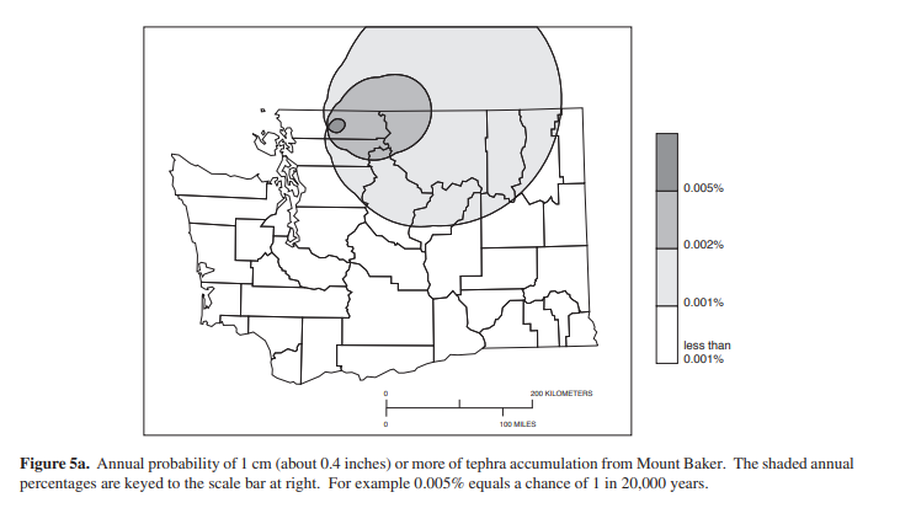
Annual probability of 1 cm (about 0.4 inches) or more of tephra from Mount Baker.
Figure 5a in: Gardner, C.A., Scott, K.M., Miller, C.D., Myers, B., Hildreth, W., & Pringle, P.T. (1995). Potential volcanic hazards from future activity of Mount Baker, Washington. U.S. Geological Survey, Open-File Report 95-498, 16 p., 1 plate, scale 1:100,000. https://doi.org/10.3133/ofr95498
Official, Figure in hazard assessment
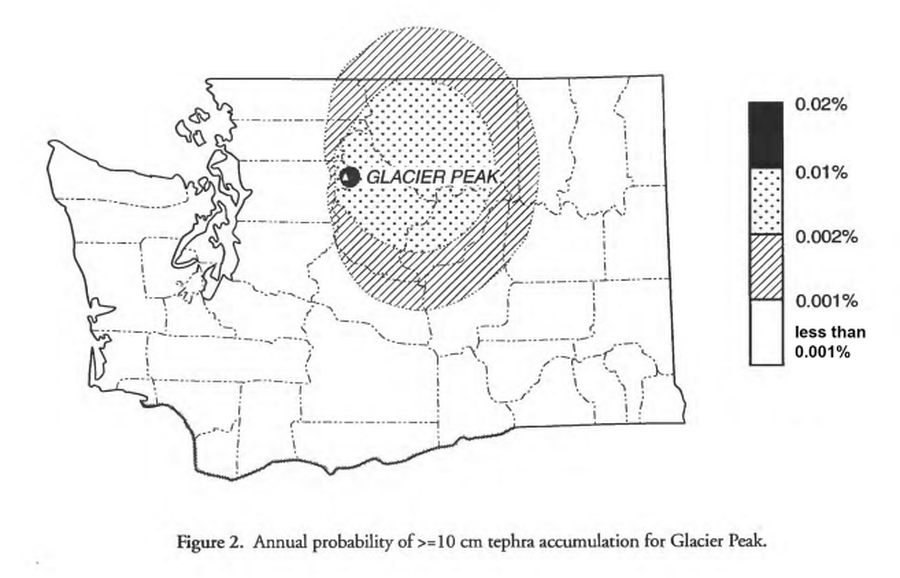
Annual probability of >=10 cm tephra accumulation for Glacier Peak
Figure 2 in: Waitt, R.B., Mastin, L.G., & Begét, J.E. (1995). Volcanic-Hazard Zonation for Glacier Peak Volcano, Washington. U.S. Geological Survey, Open-File Report 95-499, 9 p., 1 plate. https://doi.org/10.3133/ofr95499
Official, Figure in hazard assessment
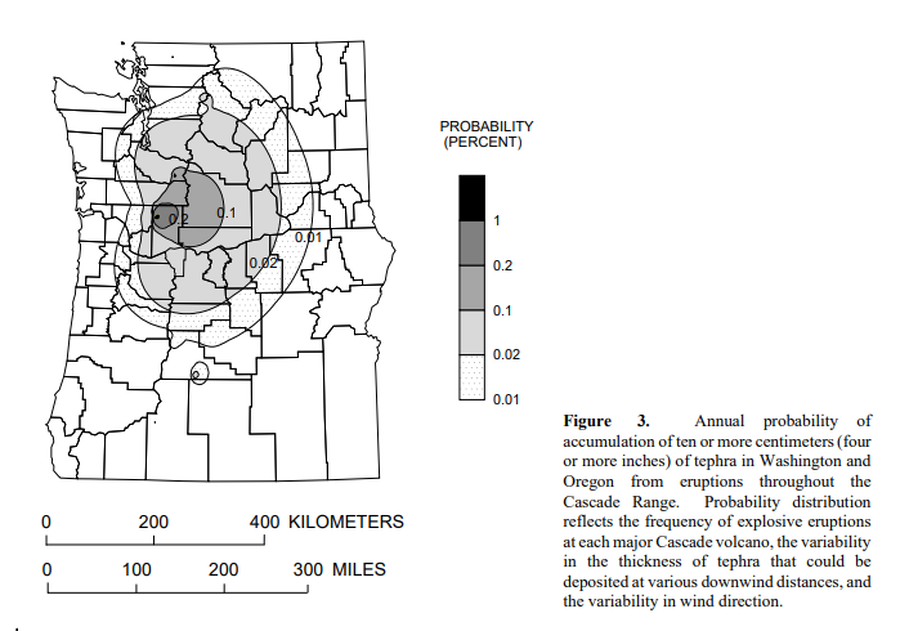
Annual probability of accumulation of ten or more centimeters (four or more inches) of tephra in Washington and Oregon from eruptions throughout the Cascade Range.
Figure 3 in: Wolfe, E.W. & Pierson, T.C. (1995). Volcanic-Hazard Zonation for Mount St. Helens, Washington, 1995. U.S. Geological Survey, Open-File Report 95-497, 12 p., 1 plate. https://doi.org/10.3133/ofr95497
Official, Map sheet or poster
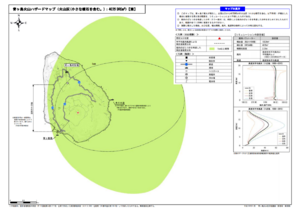
Aogashima volcano hazard map (volcanic ash (including volcanic lapilli): 4 million m³ DRE)
Aogashima Volcano Disaster Prevention Council. (2017). Aogashima volcanic hazard map. Disaster Prevention Division, Bureau of General Affairs, Tokyo Metropolitan Government.
Official, Map sheet or poster
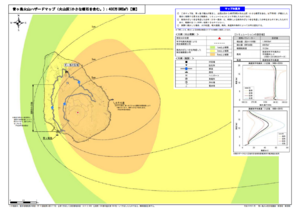
Aogashima volcano hazard map (volcanic ash (including volcanic lapilli): 400,000 m³ DRE)
Aogashima Volcano Disaster Prevention Council. (2017). Aogashima volcanic hazard map. Disaster Prevention Division, Bureau of General Affairs, Tokyo Metropolitan Government.
Official, Figure in hazard assessment
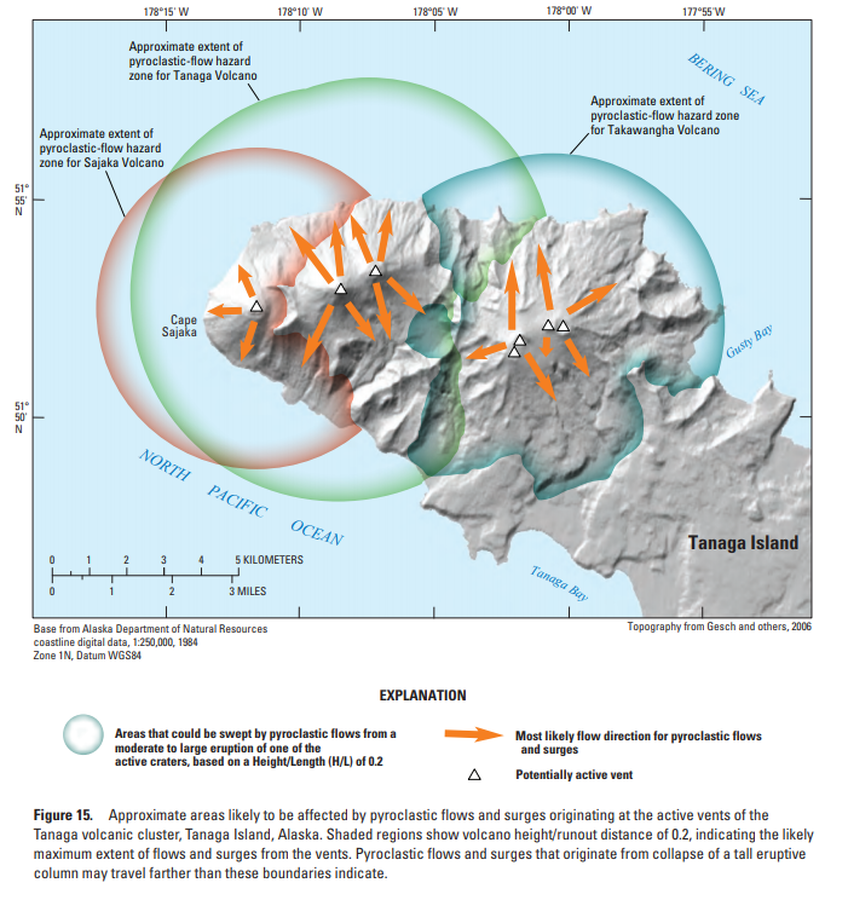
Approximate areas likely to be affected by pyroclastic flows and surges originating at the active vents of the Tanaga volcanic cluster, Tanaga Island, Alaska
Figure 15 in: Coombs, M.L., McGimsey, R.G. & Browne, B.L. (2007). Preliminary volcano-hazard assessment for the Tanaga volcanic cluster, Tanaga Island, Alaska. U.S. Geological Survey, Scientific Investigations Report 2007-5094, 41 p., 1 plate. https://doi.org/10.3133/sir20075094
Official, Figure in hazard assessment
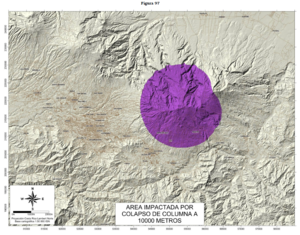
Area Impactada por Colapso de Columna a 10000 Metros
(Impacted Area from Column Collapse from 10000 Meters)
Figure 97 in: Soto, G.J. & Sjöbohm, L. (2015). Escenarios de amenaza del volcán Irazú (Costa Rica): Una aproximación preliminar. FUNDEVI, Universidad de Costa Rica, Escuela Centroamericana de Geología. 188 p. https://doi.org/10.13140/RG.2.2.22061.54240
Official, Figure in hazard assessment
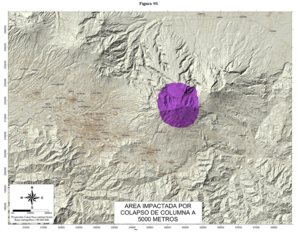
Area Impactada por Colapso de Columna a 5000 Metros
(Impacted Area from Column Collapse from 5000 Meters)
Figure 95 in: Soto, G.J. & Sjöbohm, L. (2015). Escenarios de amenaza del volcán Irazú (Costa Rica): Una aproximación preliminar. FUNDEVI, Universidad de Costa Rica, Escuela Centroamericana de Geología. 188 p. https://doi.org/10.13140/RG.2.2.22061.54240