
Advanced Search for Maps
Showing 11-20 of 32
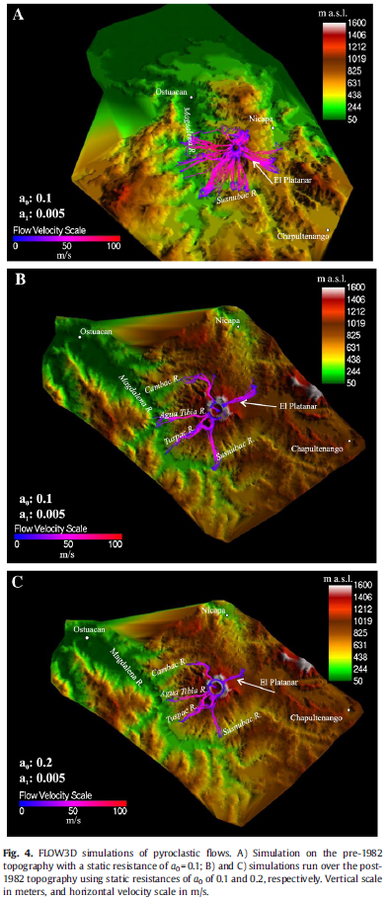
Figure in a journal article
FLOW3D simulations of pyroclastic flows
Figure 4 in: Macías, J. L., Capra, L., Arce, J. L., Espíndola, J. M., García-Palomo, A., & Sheridan, M. F. (2008). Hazard map of El Chichón volcano, Chiapas, México: Constraints posed by eruptive history and computer simulations. Journal of Volcanology and Geothermal Research, 175(4), 444-458. https://doi.org/10.1016/j.jvolgeores.2008.02.023
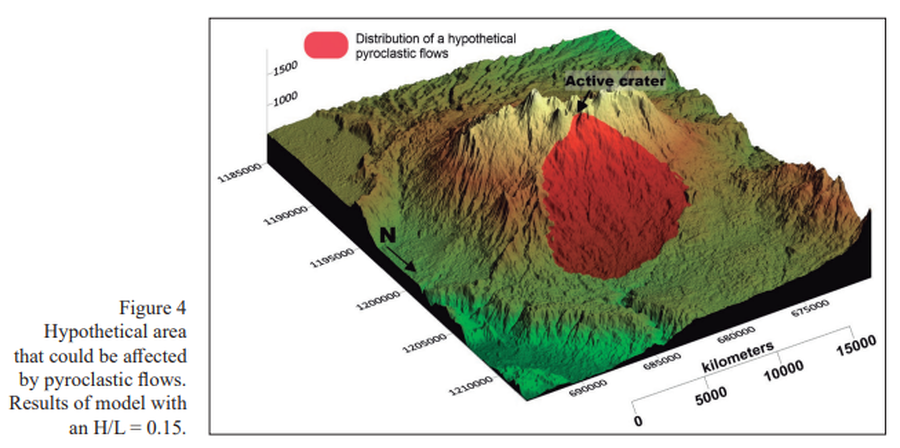
Figure in a journal article
Hypothetical area that could be affected by pyroclastic flows
Figure 4 in: Alpízar, Y., Fernández, M., Ramírez, C., & Arroyo, D. (2019). Hazard Map of Rincón de la Vieja Volcano, Costa Rica: Qualitative Integration of Computer Simulations and Geological Data. Anuario do Instituto de Geociencias, 42(3). http://dx.doi.org/10.11137/2019_3_474_488

Official, Sign or billboard
Lahar Warning Whakapapa Village
Department of Conservation. Lahar Warning Whakapapa Village.
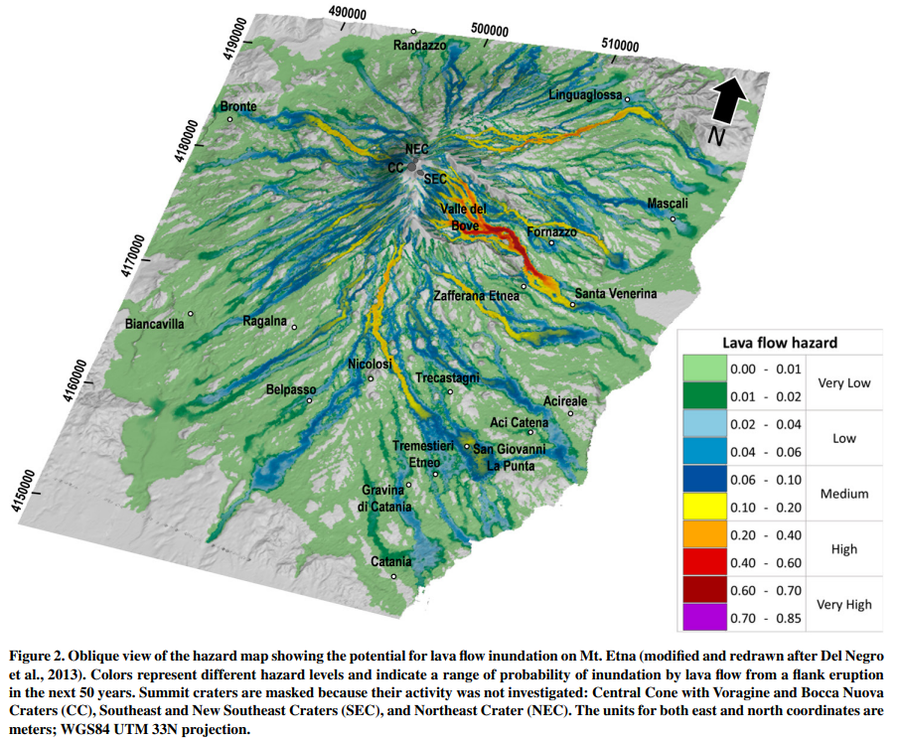
Figure in a journal article
Oblique view of the hazard map showing the potential for lava flow inundation on Mt. Etna
Figure 2 in: Del Negro, C., Cappello, A., Bilotta, G., Ganci, G., Hérault, A., & Zago, V. (2020). Living at the edge of an active volcano: Risk from lava flows on Mt. Etna. GSA Bulletin, 132(7-8), 1615-1625. https://doi.org/10.1130/B35290.1
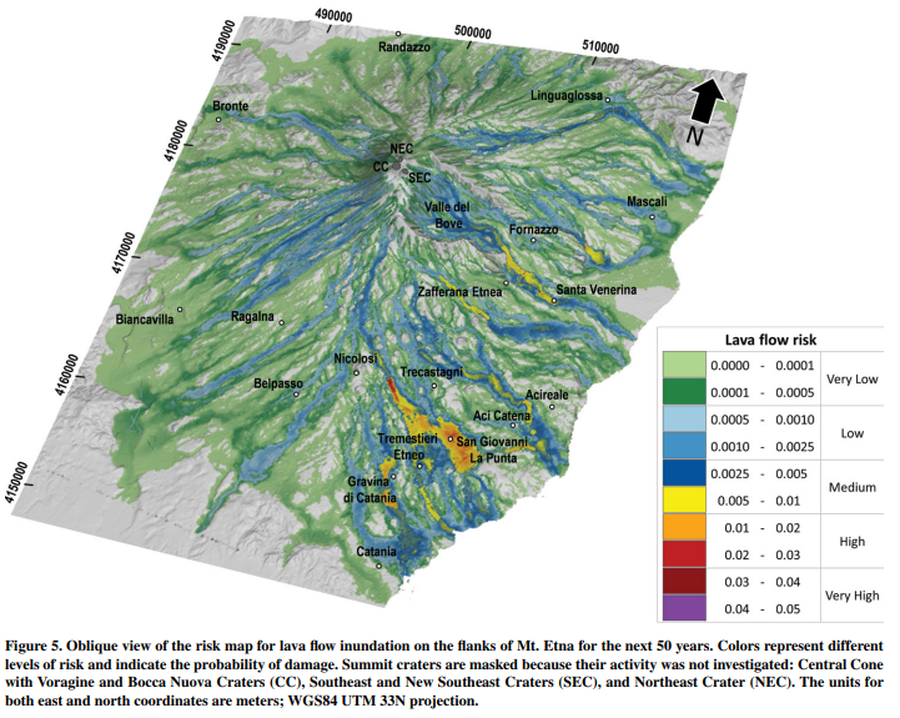
Figure in a journal article
Oblique view of the risk map for lava flow inundation on the flanks of Mt. Etna for the next 50 years
Figure 5 in: Del Negro, C., Cappello, A., Bilotta, G., Ganci, G., Hérault, A., & Zago, V. (2020). Living at the edge of an active volcano: Risk from lava flows on Mt. Etna. GSA Bulletin, 132(7-8), 1615-1625. https://doi.org/10.1130/B35290.1
Official, Figure on website
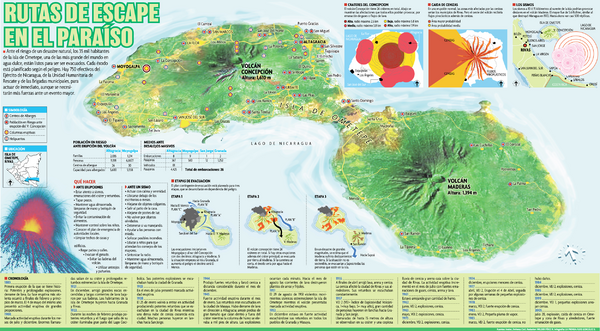
Rutas de Escape en el Paraíso
(Escape Routes in Paraíso)
Wilder Pérez, R. & Luis González. (Year Unknown). Rutas de Escape en el Paraíso. La Prensa. https://webserver2.ineter.gob.ni/geofisica/vol/concepcion/doc/rutas-evacuacion.htm
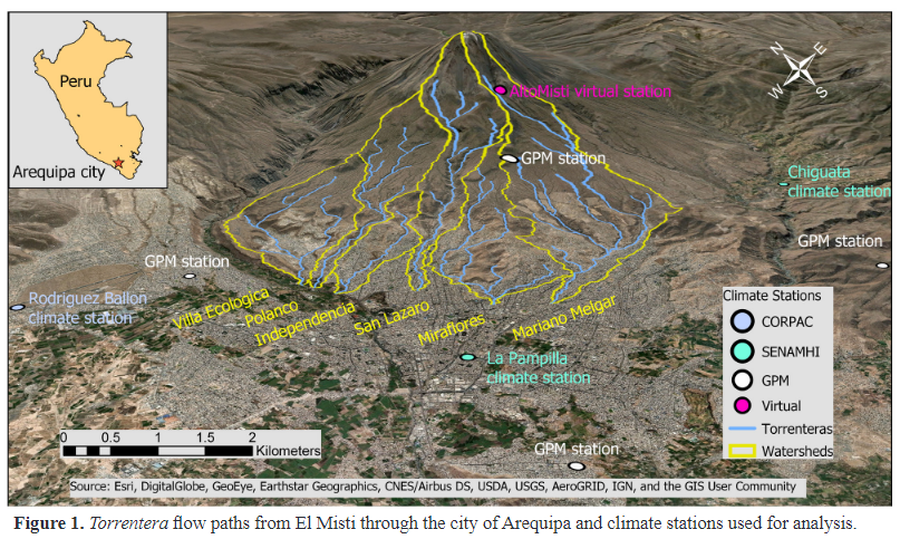
Figure in a journal article
Torrentera flow paths from El Misti through the city of Arequipa and climate stations used for analysis
Figure 1 in: Mazer, K. E., Tomasek, A. A., Daneshvar, F., Bowling, L. C., Frankenberger, J. R., McMillan, S. K., Novoa, H.M., & Zeballos‐Velarde, C. (2021). Integrated hydrologic and hydraulic analysis of torrential flood hazard in Arequipa, Peru. Journal of Contemporary Water Research & Education, 171(1), 93-110. https://doi.org/10.1111/j.1936-704X.2020.3347.x
Official, Figure in hazard assessment
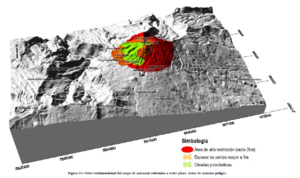
Vista tridimensional del mapa de amenaza volcánica a corto plazo, áreas de máximo peligro
(Three-dimensional view of the short-term volcanic hazard map, areas of maximum danger)
Figure 91 in: Soto, G.J. (2012). Preparación de mapas de peligros volcánicos y restricción de uso de la tierra en el volcán Turrialba. FUNDEVI, Universidad de Costa Rica, Escuela Centroamericana de Geología. 186 p.
Official, Figure in hazard assessment
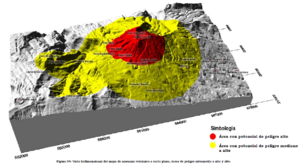
Vista tridimensional del mapa de amenaza volcánica a corto plazo, áreas de peligro intermedio a alto y alto
(Three-dimensional view of the short-term volcanic hazard map, intermediate to high and high hazard areas)
Figure 94 in: Soto, G.J. (2012). Preparación de mapas de peligros volcánicos y restricción de uso de la tierra en el volcán Turrialba. FUNDEVI, Universidad de Costa Rica, Escuela Centroamericana de Geología. 186 p.
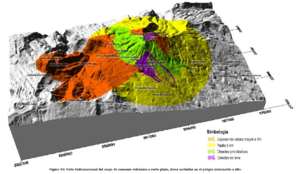
Official, Figure in hazard assessment
Vista tridimensional del mapa de amenaza volcánica a corto plazo, áreas incluidas en el peligro intermedio a alto
(Three-dimensional view of the short-term volcanic hazard map, areas included in intermediate to high hazard)
Figure 93 in: Soto, G.J. (2012). Preparación de mapas de peligros volcánicos y restricción de uso de la tierra en el volcán Turrialba. FUNDEVI, Universidad de Costa Rica, Escuela Centroamericana de Geología. 186 p.