
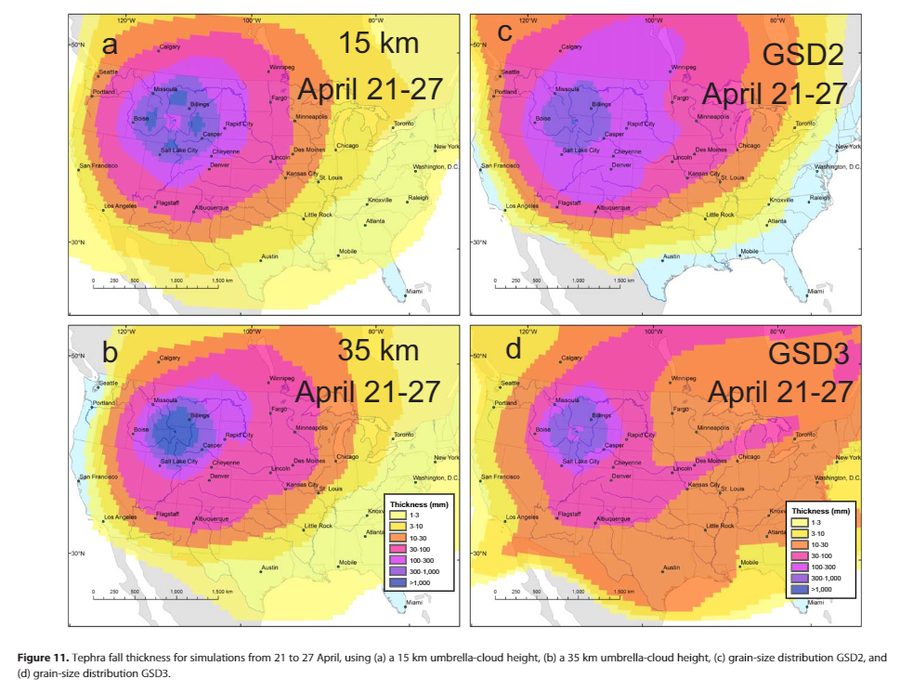
Tephra fall thickness for simulations from 21 to 27 April, using (a) a 15 km umbrella-cloud height, (b) a 35 km umbrella-cloud height, (c) grain-size distribution GSD2, and(d) grain-size distribution GSD3.
Yellowstone, United States, 2014
Figure 11 in: Mastin, L.G., Van Eaton, A.R., & Lowenstern, J.B. (2014). Modeling ash fall distribution from a Yellowstone supereruption. Geochemistry, Geophysics, Geosystems, 15(8), 3459-3475. https://doi.org/10.1002/2014GC005469
This map was produced by an official agency, but may not be the most recent, most complete, or main operational map.
For the current operational hazard map, please consult the proper institutional authorities.
Click on image for full-size map.
Map Set
Mastin, L. G., Van Eaton, A. R., & Lowenstern, J. B. (2014). Modeling ash fall distribution from a Yellowstone supereruption. Geochemistry, Geophysics, Geosystems, 15(8), 3459-3475. https://doi.org/10.1002/2014GC005469
https://doi.org/10.1002/2014GC005469
Other Maps In Set:
- Simulated tephra fall thickness resulting from a month-long Yellowstone eruption of 330 km³ using 2001 wind fields for (a) January, (b) April, (c) July, and (d) October.
- Simulated tephra fall thickness resulting from a week-long Yellowstone eruption of 330 km³ using 2001 wind fields for (a) 21–27 January, (b) 21–27 April, 21–27 July, and(d) 21–27 October.
- Simulated tephra fall thickness resulting from a 3-day-long Yellowstone eruption of 330 km³ using 2001 wind fields for (a) 14–16 January, (b) 14–16 April, (c) 14–16 July, and(d) 14–16 October.
- Results of simulations with no umbrella cloud: (a) 1 month (January); 1 week(21–27 January); and 3 days (14–16 January