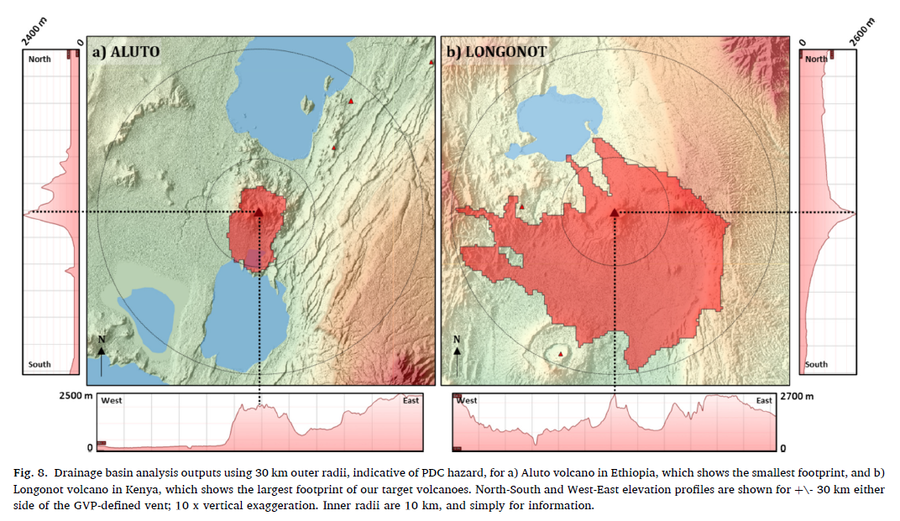
← Back to Search ResultsDrainage basin analysis outputs using 30 km outer radii, indicative of PDC hazard, for a) Aluto volcano in Ethiopia, which shows the smallest footprint, and b) Longonot volcano in Kenya, which shows the largest footprint of our target volcanoes
Aluto & Longonot, Ethiopia, Kenya, 2024
Figure 8 in: Jenkins, S. F., Mee, K., Engwell, S. L., Loughlin, S. C., Faria, B. V. E., Yirgu, G., ... & Crummy, J. (2024). Assessing volcanic hazard and exposure in a data poor context: Case study for Ethiopia, Kenya, and Cabo Verde. Progress in Disaster Science, 23, 100350.
This hazard map is the result of scientific research and was published in academic literature.
It is presented here to serve as an example of the map type or the map-making methodology. It is NOT the official, operational map. For the current operational hazard map, please consult the proper institutional authorities.
Click on image for full-size map. If link seems broken, try the archived
version.Map Set
Jenkins, S. F., Mee, K., Engwell, S. L., Loughlin, S. C., Faria, B. V. E., Yirgu, G., ... & Crummy, J. (2024). Assessing volcanic hazard and exposure in a data poor context: Case study for Ethiopia, Kenya, and Cabo Verde. Progress in Disaster Science, 23, 100350.
https://doi.org/10.1016/j.pdisas.2024.100350
Other Maps In Set:
- Calculated tephra fall contours for the three thresholds used for assessing exposure: 0.5, 10 and 50 mm, for Menengai volcano in Kenya (left) and Fogo volcano in Cabo Verde (right) for the three return periods defined by GFDRR: 1000 years (upper), 500 years (upper middle), 250 years (lower middle), and for a VEI 4 simulation that impacts large population centres (lower)
- Potential hazard zones produced by the drainage basin analysis for a 30 km buffer applied to: a) Suswa in Kenya and b) Fentale in Ethiopia when two different vent locations are used: that given by Smithsonian Institution’s Global Volcanism Program at the time of our study (blue triangle and shaded area) and that given by the centre of the summit crater (black triangle and outline)
- Drainage basin analyses footprints created using two different buffer extents: 3 km (top) and 10 km (bottom) and from three different DEM resolutions for a/e) Fogo, b/f) Brava, c/g) Santo Antão – Topo de Coroa, d/h) Santo Antão – Cova de Paul
- Model for spatial density (% per km2) of volcanic vents on a) Brava island, based on 29 identified vents, and b) Santo Antão island, based on 76 identified vents
- Model for spatial density of volcanic vents on Fogo island, based on all 115 (left) and only the 57 post-1680 (right) identified vents
Map Data
Go to Global Volcanism Program page for Aluto & Longonot →

