
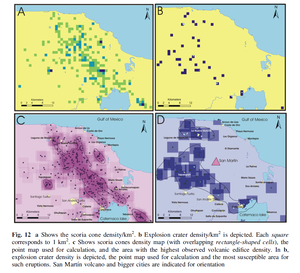
Fig. 12 a Shows the scoria cone density/km². b Explosion crater density/km² is depicted. Each square corresponds to 1 km2. c Shows scoria cones density map (with overlapping rectangle-shaped cells), the point map used for calculation, and the area with the highest observed volcanic edifice density.
San Martín, Mexico, 2014
Figure 12 in: Sieron, K., Capra, L., & Rodríguez-Elizararrás, S. (2014). Hazard assessment at San Martín volcano based on geological record, numerical modeling, and spatial analysis. Natural hazards, 70(1), 275-297. https://doi.org/10.1007/s11069-013-0807-7
This hazard map is the result of scientific research and was published in academic literature.
It is presented here to serve as an example of the map type or the map-making methodology. It is NOT the official, operational map. For the current operational hazard map, please consult the proper institutional authorities.
Click on thumbnail for full-size map. We do not have copyright permission to display the full-size image. If you are the copyright holder and wish to provide copyright, please contact us at admin@volcanichazardmaps.org. If link seems broken, try the archived version.
Sieron, K., Capra, L., & Rodríguez-Elizararrás, S. (2014). Hazard assessment at San Martín volcano based on geological record, numerical modeling, and spatial analysis. Natural hazards, 70(1), 275-297. https://doi.org/10.1007/s11069-013-0807-7Map Set
https://rdcu.be/cJO2l
Other Maps In Set: