
Advanced Search for Maps
Showing 1491-1500 of 2217
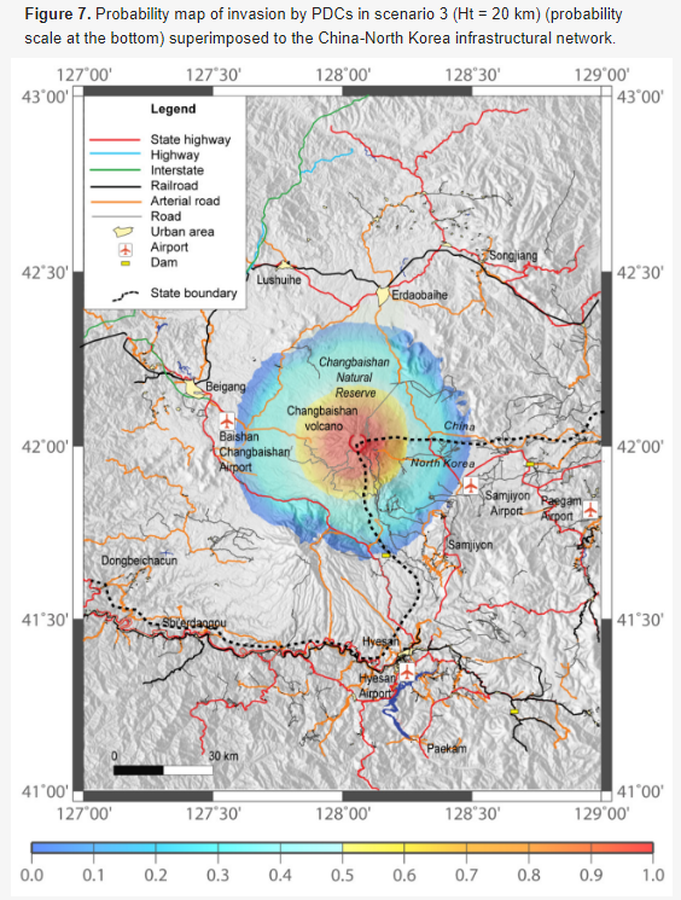
Figure in a journal article
Probability map of invasion by PDCs in scenario 3
Figure 7 in: Lombardi AM, Del Gaudio P, Guo Z, Zhang M, Liu G, Sepe V, Liu J, Ventura G. (2020). Scenario-Based Pyroclastic Density Current Invasion Maps at Poorly Known Volcanoes: A Case Study from Changbaishan (China/North Korea). Applied Sciences, 10(7), 2622. https://doi.org/10.3390/app10072622
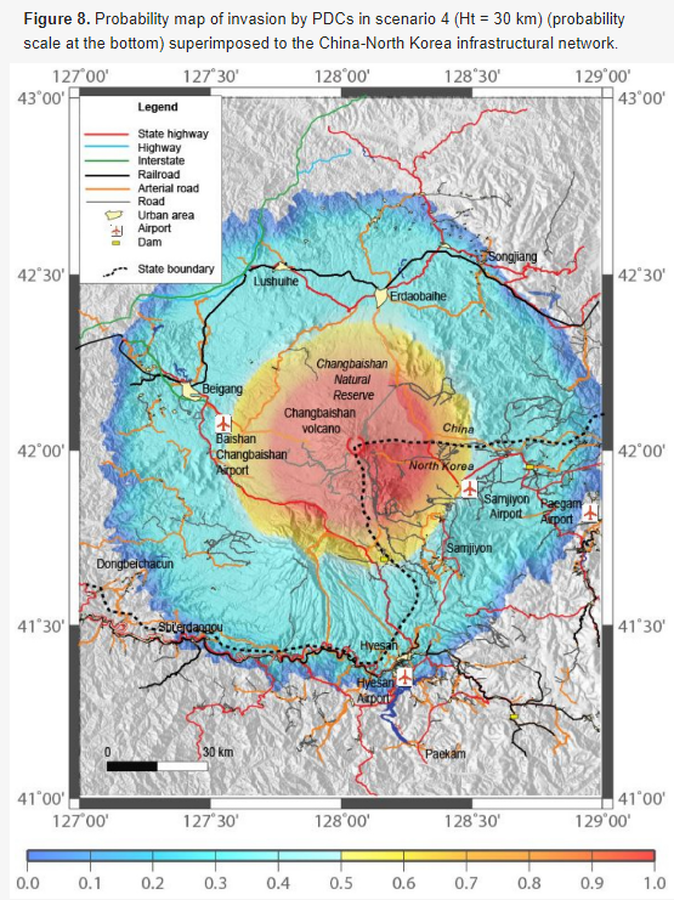
Figure in a journal article
Probability map of invasion by PDCs in scenario 4
Figure 8 in: Lombardi AM, Del Gaudio P, Guo Z, Zhang M, Liu G, Sepe V, Liu J, Ventura G. (2020). Scenario-Based Pyroclastic Density Current Invasion Maps at Poorly Known Volcanoes: A Case Study from Changbaishan (China/North Korea). Applied Sciences, 10(7), 2622. https://doi.org/10.3390/app10072622
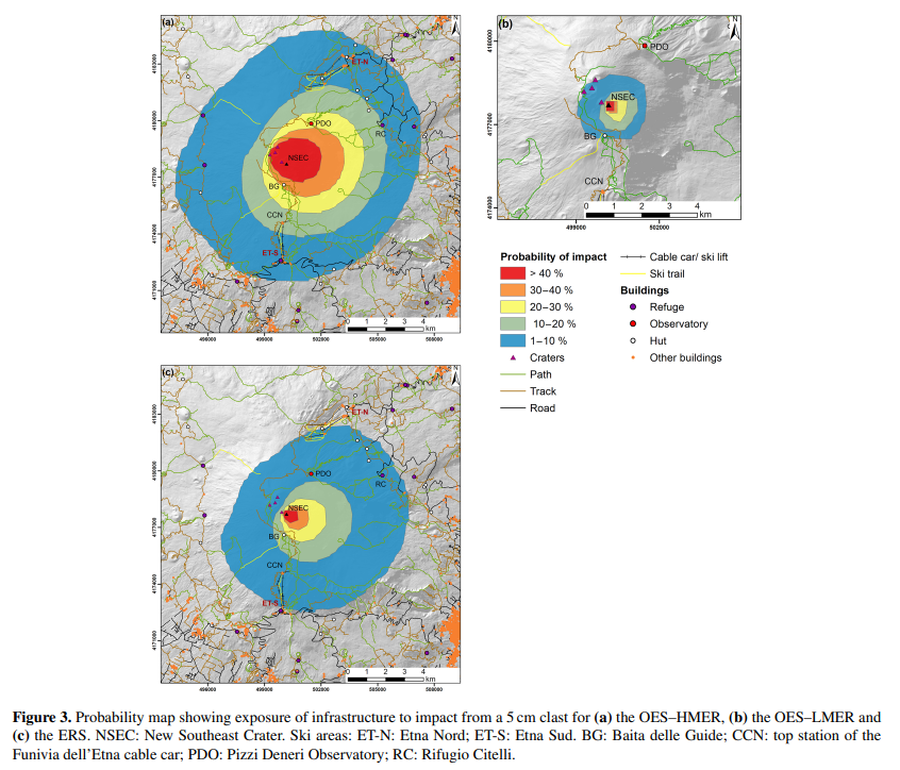
Figure in a journal article
Probability map showing exposure of infrastructure to impact from a 5 cm clast
Figure 3 in: Osman, S., Rossi, E., Bonadonna, C., Frischknecht, C., Andronico, D., Cioni, R., & Scollo, S. (2019). Exposure-based risk assessment and emergency management associated with the fallout of large clasts at Mount Etna. Natural Hazards and Earth System Sciences, 19(3), 589-610. https://doi.org/10.5194/nhess-19-589-2019
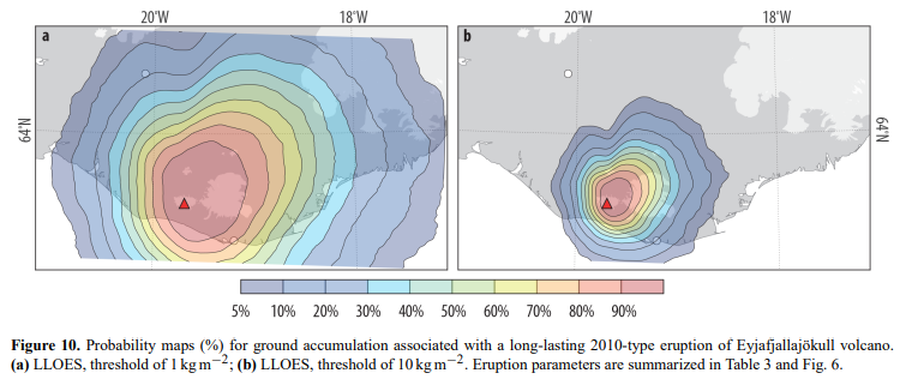
Figure in a journal article
Probability maps (%) for ground accumulation associated with a long-lasting 2010-type eruption of Eyjafjallajökull volcano
Figure 10 in: Biass, S., Scaini, C., Bonadonna, C., Folch, A., Smith, K., & Höskuldsson, A. (2014). A multi-scale risk assessment for tephra fallout and airborne concentration from multiple Icelandic volcanoes–Part 1: Hazard assessment. Natural hazards and earth system sciences, 14(8), 2265-2287. https://doi.org/10.5194/nhess-14-2265-2014
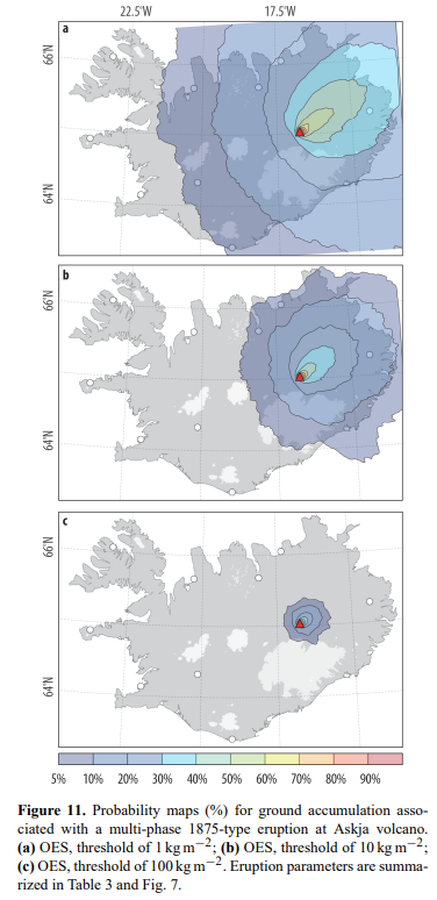
Figure in a journal article
Probability maps (%) for ground accumulation associated with a multi-phase 1875-type eruption at Askja volcano
Figure 11 in: Biass, S., Scaini, C., Bonadonna, C., Folch, A., Smith, K., & Höskuldsson, A. (2014). A multi-scale risk assessment for tephra fallout and airborne concentration from multiple Icelandic volcanoes–Part 1: Hazard assessment. Natural hazards and earth system sciences, 14(8), 2265-2287. https://doi.org/10.5194/nhess-14-2265-2014
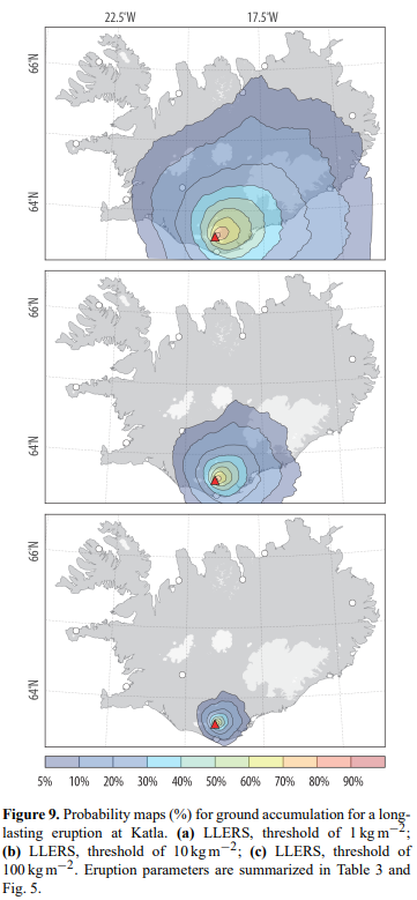
Figure in a journal article
Probability maps (%) for ground accumulation for a longlasting eruption at Katla
Figure 9 in: Biass, S., Scaini, C., Bonadonna, C., Folch, A., Smith, K., & Höskuldsson, A. (2014). A multi-scale risk assessment for tephra fallout and airborne concentration from multiple Icelandic volcanoes–Part 1: Hazard assessment. Natural hazards and earth system sciences, 14(8), 2265-2287. https://doi.org/10.5194/nhess-14-2265-2014
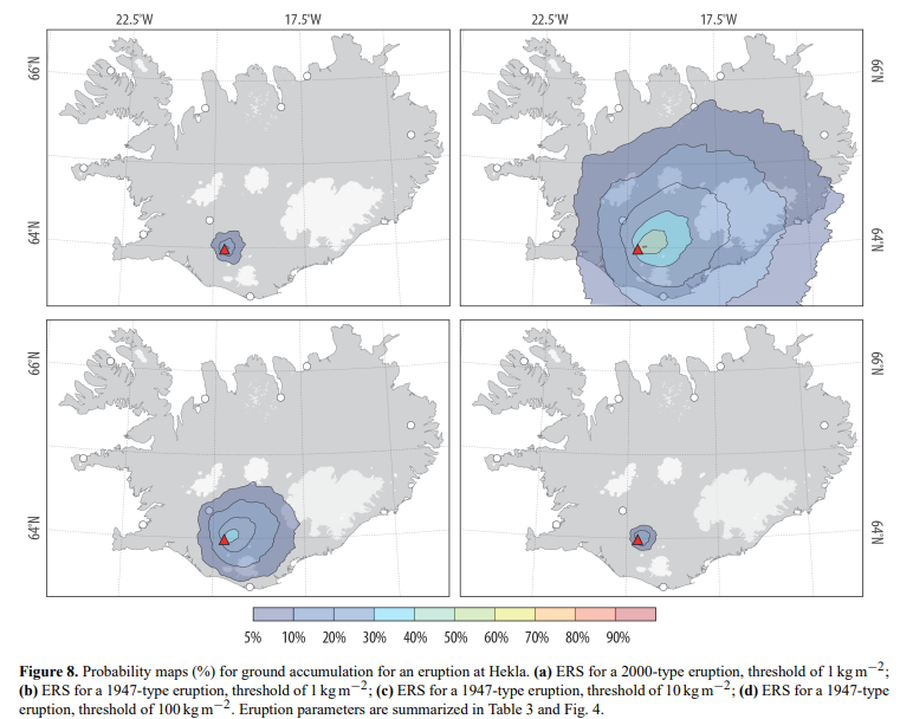
Figure in a journal article
Probability maps (%) for ground accumulation for an eruption at Hekla
Figure 8 in: Biass, S., Scaini, C., Bonadonna, C., Folch, A., Smith, K., & Höskuldsson, A. (2014). A multi-scale risk assessment for tephra fallout and airborne concentration from multiple Icelandic volcanoes–Part 1: Hazard assessment. Natural hazards and earth system sciences, 14(8), 2265-2287. https://doi.org/10.5194/nhess-14-2265-2014
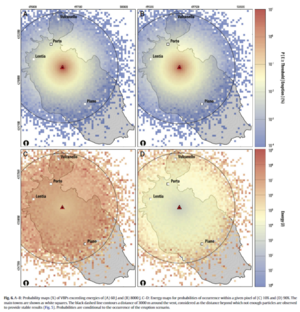
Figure in a journal article
Probability maps (%) of VBPs exceeding energies of (A) 60 J and (B) 8000 J. Energy maps for probabilities of occurrence within a given pixel of (C) 10% and (D) 90%.
Figure 6 in: Biass, S., Falcone, J. L., Bonadonna, C., Di Traglia, F., Pistolesi, M., Rosi, M., & Lestuzzi, P. (2016). Great Balls of Fire: A probabilistic approach to quantify the hazard related to ballistics—A case study at La Fossa volcano, Vulcano Island, Italy. Journal of Volcanology and Geothermal Research, 325, 1-14. https://doi.org/10.1016/j.jvolgeores.2016.06.006
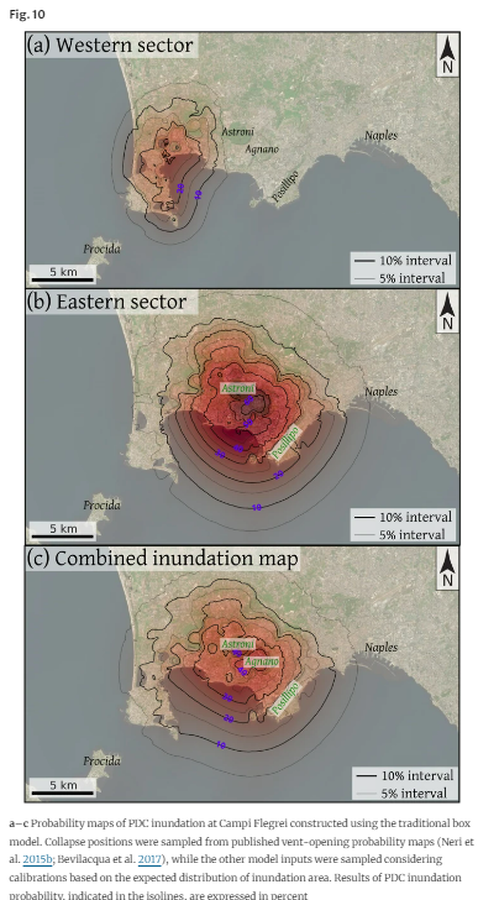
Figure in a journal article
Probability maps of PDC inundation at Campi Flegrei constructed using the traditional box model
Figure 10 in: Aravena, A., Bevilacqua, A., de’Michieli Vitturi, M., Esposti Ongaro, T., Neri, A., & Cioni, R. (2022). Calibration strategies of PDC kinetic energy models and their application to the construction of hazard maps. Bulletin of Volcanology, 84(3), 29.
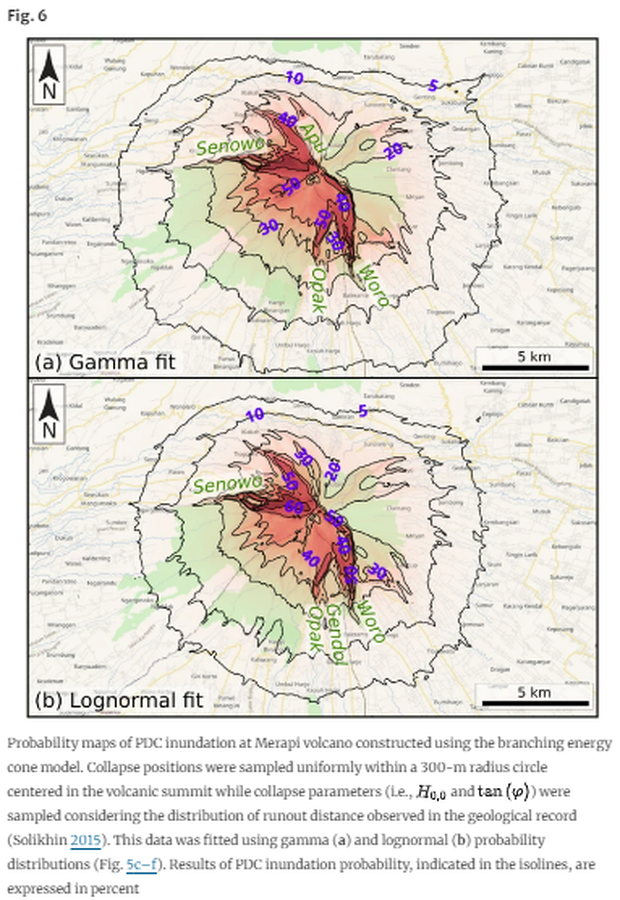
Figure in a journal article
Probability maps of PDC inundation at Merapi volcano constructed using the branching energy cone model
Figure 5 in: Aravena, A., Bevilacqua, A., de’Michieli Vitturi, M., Esposti Ongaro, T., Neri, A., & Cioni, R. (2022). Calibration strategies of PDC kinetic energy models and their application to the construction of hazard maps. Bulletin of Volcanology, 84(3), 29.