
Advanced Search for Maps
Showing 1461-1470 of 2217
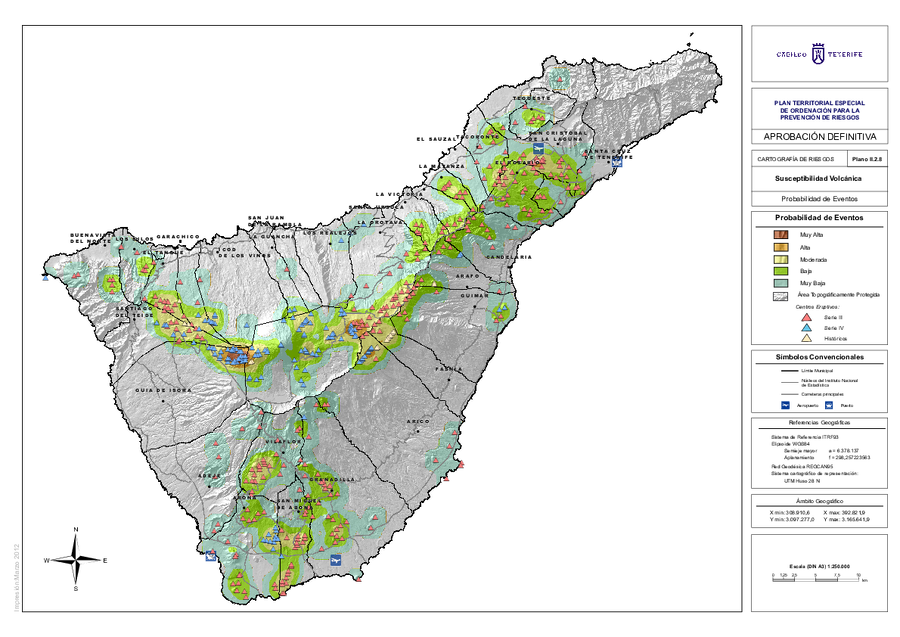
Official, Insert/poster-size map with accompanying report
Probabilidad de Eventos
(Event Probability)
Map II.2.8 in: Cabildo Tenerife. (2012). Plan Territorial Especial de Ordenación para la Prevención de Riesgos. Documento Cartográfico (Planos de Información).
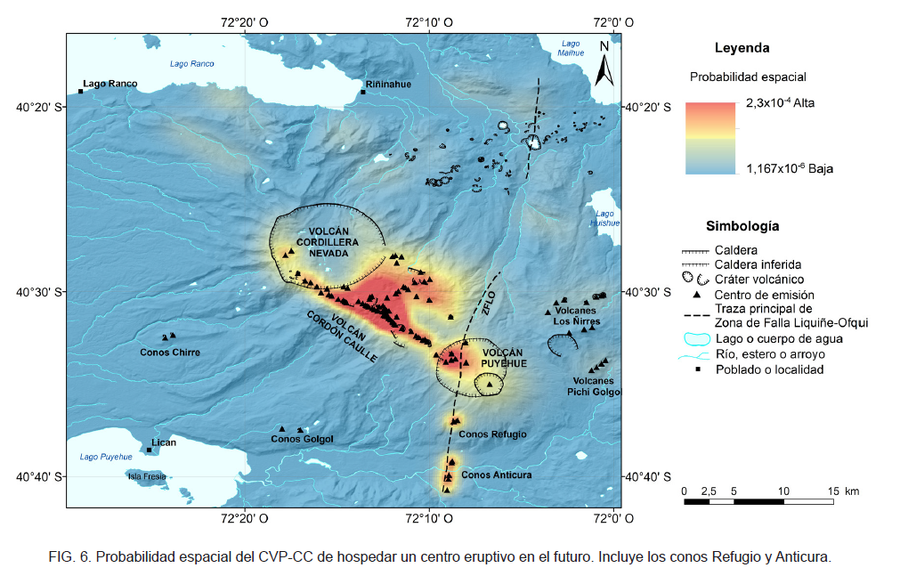
Official, Figure in hazard assessment
Probabilidad espacial del CVP-CC de hospedar un centro eruptivo en el futuro
(Spatial probability of the CVP-CC of hosting an eruptive center in the future)
Figure 6 in: Toloza, V., Jorquera, C., Mella, M., Gho, R. (2020). Peligros del Complejo Volcánico Puyehue-Cordón Caulle, regiones de Los Ríos y Los Lagos. Servicio Nacional de Geología y Minería, Carta Geológica de Chile, Serie Geología Ambiental 36, 63 p., 1 mapa escala 1:75.000. Santiago.
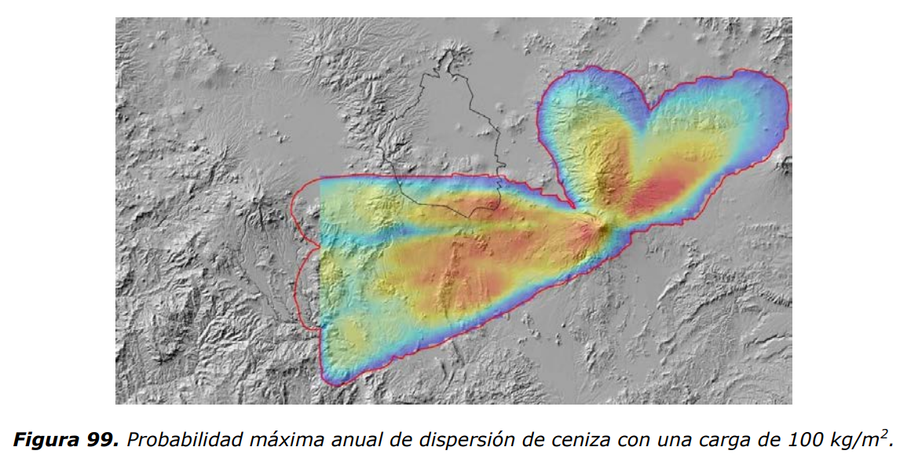
Official, Figure in hazard assessment
Probabilidad máxima anual de dispersión de ceniza con una carga de 100 kg/m²
(Annual maximum probability of ash dispersion with a load of 100 kg/m²)
Figure 99 in: Martin Del Pozzo, A.L, Alatorre Ibargüengoitia M., Arana Salinas L., Bonasia R., Capra Pedol L., Cassata W., Cordoba G., Cortés Ramos J., Delgado Granados H., Ferrés López M.D., Fonseca Álvarez R., García Reynoso J.A., Gisbert G., Guerrero López D.A., Jaimes Viera M., Macías Vázquez J.L., Nieto Obregon J., Nieto Torres A., Paredes Ruiz P.A., Portocarrero Martínez J., Renne P., Rodríguez Espinosa D.M., Salinas Sánchez S., Siebe Grabach C., & Tellez Ugalde E. (2017). Estudios geológicos y actualización del mapa de peligros del volcán Popocatépetl. Memoria técnica del mapa de peligros del volcán Popocatépetl. Instituto de Geofísica, Universidad Nacional Autónoma de México (UNAM).
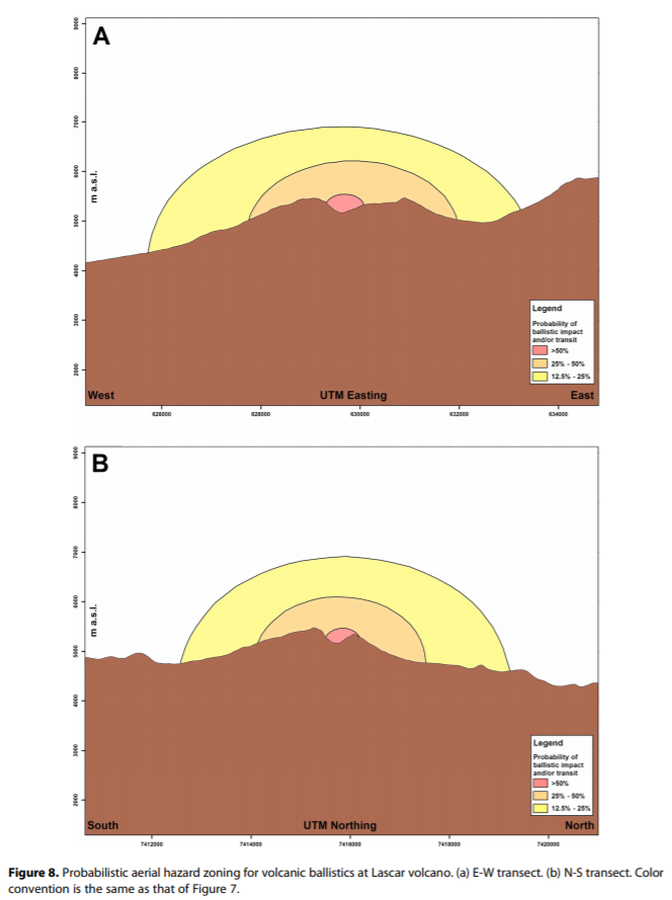
Figure in a journal article
Probabilistic aerial hazard zoning for volcanic ballistics at Lascar volcano
Figure 8 in: Bertin, D. (2017). 3‐D ballistic transport of ellipsoidal volcanic projectiles considering horizontal wind field and variable shape‐dependent drag coefficients. Journal of Geophysical Research: Solid Earth, 122(2), p. 1126-1151. https://doi.org/10.1002/2016JB013320
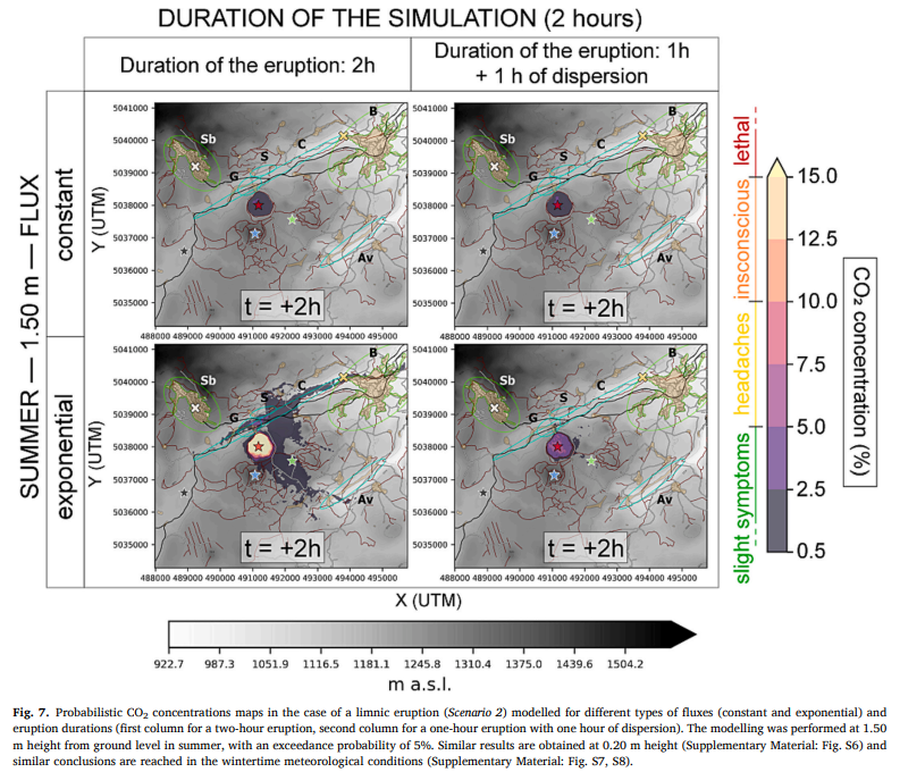
Figure in a journal article
Probabilistic CO2 concentrations maps in the case of a limnic eruption (Scenario 2) modelled for different types of fluxes (constant and exponential) and eruption durations (first column for a two-hour eruption, second column for a one-hour eruption with one hour of dispersion).
Figure 7 in: Rafflin, V., Boudoire, G., Massaro, S., Stocchi, M., Costa, A., Grassa, F., Giuffrida, G., Gailler, L., Planche, C., Banson, S., & Harris, A. (2024). Modelling CO2 dispersion in the air during potential limnic eruption at the lake Pavin (France). Journal of Volcanology and Geothermal Research, 108024. https://doi.org/10.1016/j.jvolgeores.2024.108024
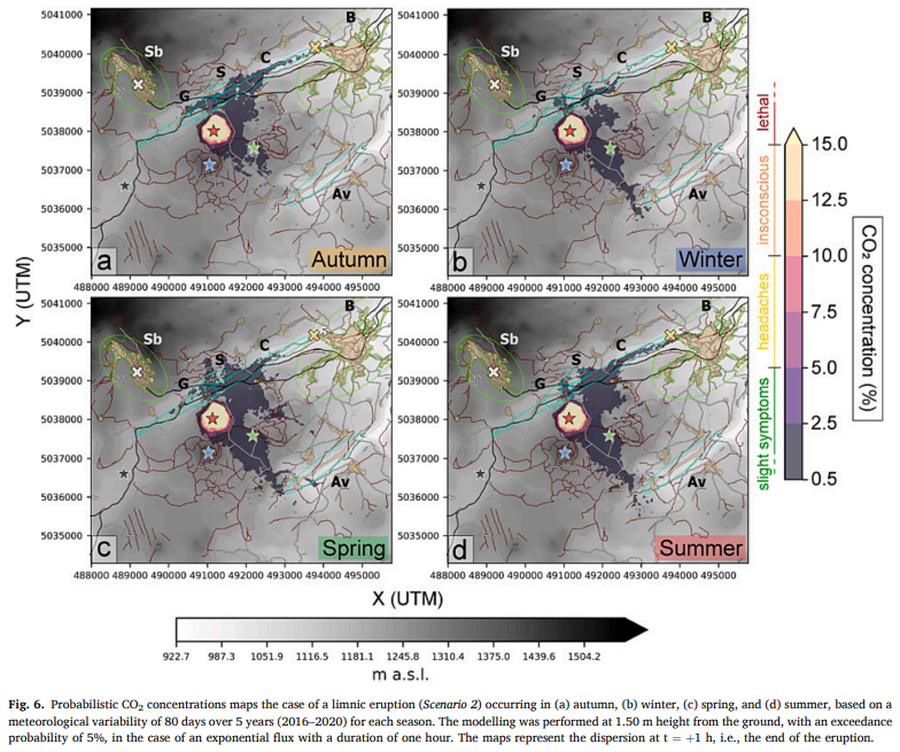
Figure in a journal article
Probabilistic CO2 concentrations maps the case of a limnic eruption (Scenario 2) occurring in (a) autumn, (b) winter, (c) spring, and (d) summer, based on a meteorological variability of 80 days over 5 years (2016–2020) for each season
Figure 6 in: Rafflin, V., Boudoire, G., Massaro, S., Stocchi, M., Costa, A., Grassa, F., Giuffrida, G., Gailler, L., Planche, C., Banson, S., & Harris, A. (2024). Modelling CO2 dispersion in the air during potential limnic eruption at the lake Pavin (France). Journal of Volcanology and Geothermal Research, 108024. https://doi.org/10.1016/j.jvolgeores.2024.108024
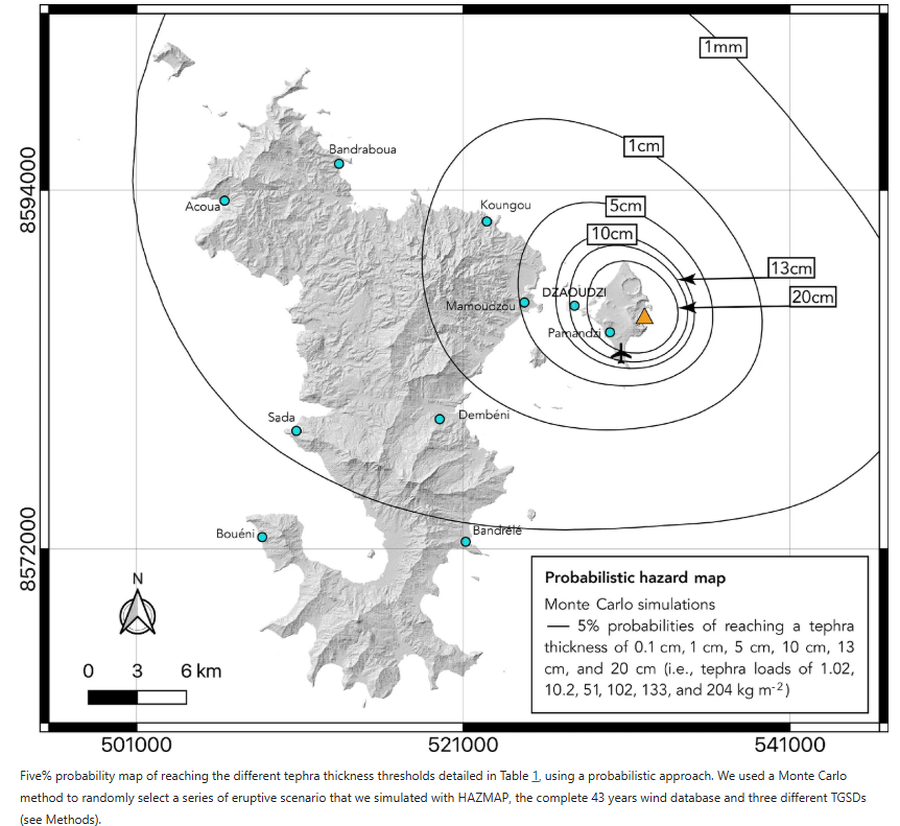
Figure in a journal article
Probabilistic hazard map
Figure 4 in: Michaud-Dubuy, A., Komorowski, J. C., Lacombe, T., & Gurioli, L. (2024). Tephra fallout hazard assessment for a hydrovolcanic eruptive scenario in Mayotte. Scientific Reports, 14(1), 31880.
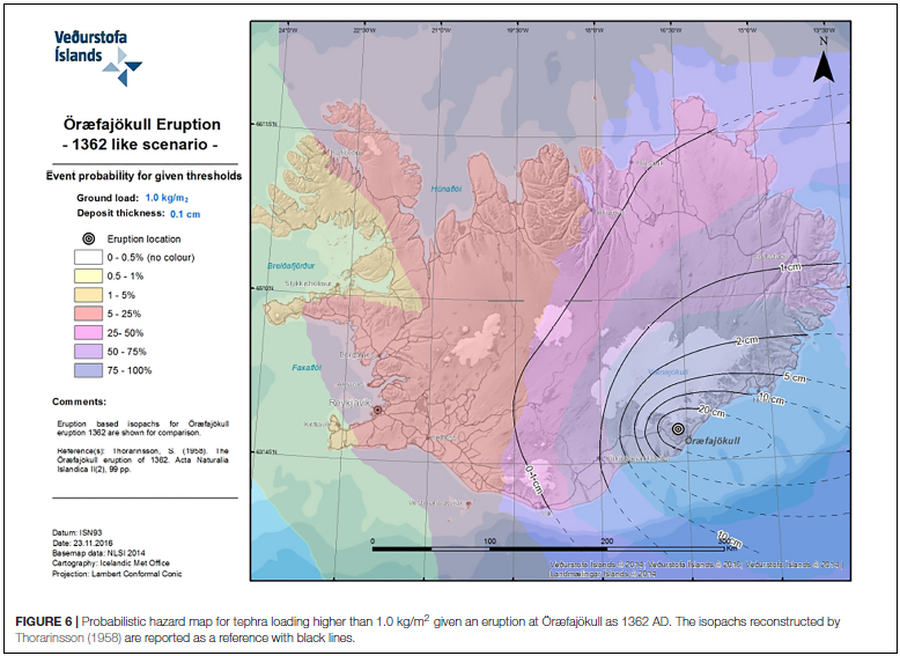
Figure in a journal article
Probabilistic hazard map for tephra loading higher than 1.0 kg/m2 given an eruption at Öræfajökull as 1362 AD
Figure 6 in: Barsotti, S., Di Rienzo, D. I., Thordarson, T., Björnsson, B. B., & Karlsdóttir, S. (2018). Assessing impact to infrastructures due to tephra fallout from Öræfajökull volcano (Iceland) by using a scenario-based approach and a numerical model. Frontiers in Earth Science, 6, 196. https://doi.org/10.3389/feart.2018.00196
Öræfajökull, Iceland
Figure in a journal article
Probabilistic hazard map for tephra loading higher than 100 kg/m² given an eruption at Öræfajökull as 1362 AD
Figure 7 in: Barsotti, S., Di Rienzo, D. I., Thordarson, T., Björnsson, B. B., & Karlsdóttir, S. (2018). Assessing impact to infrastructures due to tephra fallout from Öræfajökull volcano (Iceland) by using a scenario-based approach and a numerical model. Frontiers in Earth Science, 6, 196. https://doi.org/10.3389/feart.2018.00196
Figure in a journal article
Probabilistic hazard map for tephra loading higher than 100 kg/m² given an eruption at Öræfajökull as 1362 AD
Figure 7 in: Barsotti, S., Di Rienzo, D. I., Thordarson, T., Björnsson, B. B., & Karlsdóttir, S. (2018). Assessing impact to infrastructures due to tephra fallout from Öræfajökull volcano (Iceland) by using a scenario-based approach and a numerical model. Frontiers in Earth Science, 6, 196. https://doi.org/10.3389/feart.2018.00196
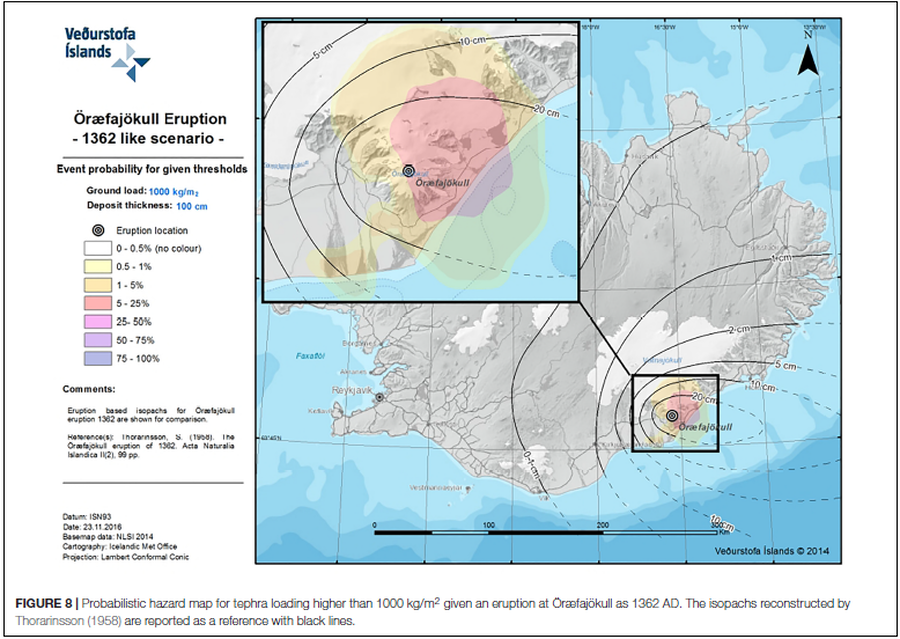
Figure in a journal article
Probabilistic hazard map for tephra loading higher than 1000 kg/m² given an eruption at Öræfajökull as 1362 AD
Figure 8 in: Barsotti, S., Di Rienzo, D. I., Thordarson, T., Björnsson, B. B., & Karlsdóttir, S. (2018). Assessing impact to infrastructures due to tephra fallout from Öræfajökull volcano (Iceland) by using a scenario-based approach and a numerical model. Frontiers in Earth Science, 6, 196. https://doi.org/10.3389/feart.2018.00196