
Advanced Search for Maps
Showing 1541-1550 of 2217
Official, Figure in hazard assessment
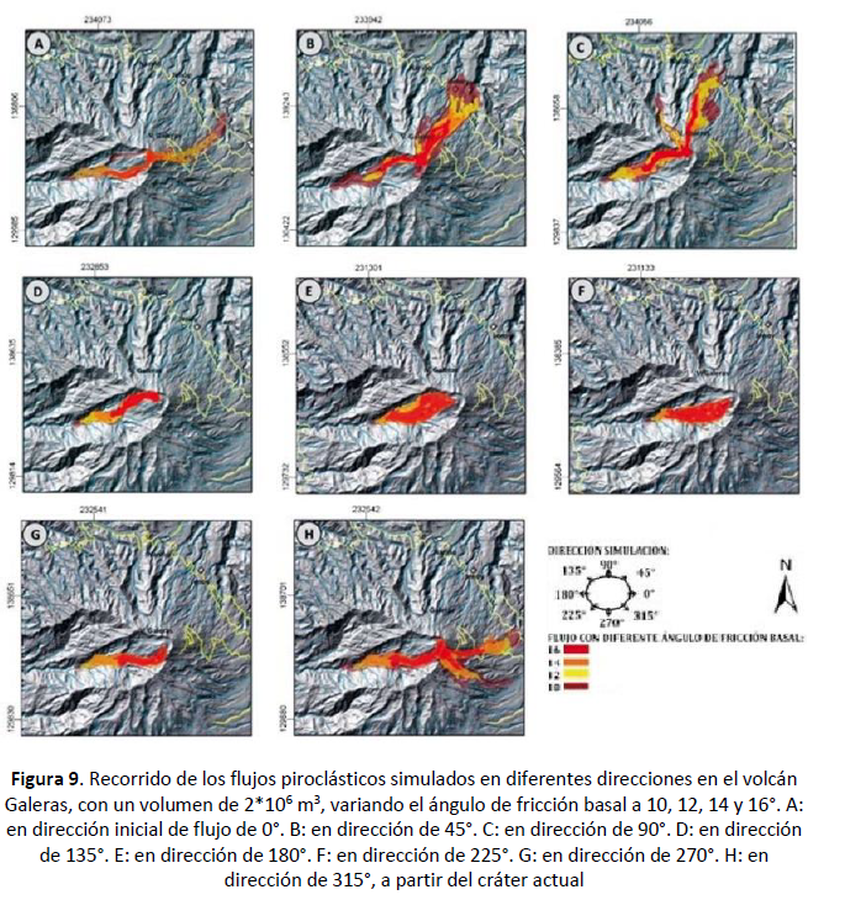
Recorrido de los flujos piroclásticos simulados en diferentes direcciones en el volcán Galeras
(Path of simulated pyroclastic flows in different directions on the Galeras volcano)
Figure 9 in: Servicio Geológico Colombiano (SGC) Direccion de Geoamenazas. (2015). Implementación de Herramientas Computacionales para la Simulación de Fenómenos Volcánicos, Como Soporte en la Actualización del Mapa de Amenaza del Volcánica Del Volcán Galeras – Colombia, Informe Técnico de Simulaciones. En cumplimiento a la Sentencia de la Corte Constitucional T-269 de 2015.
Official, Figure in a journal article
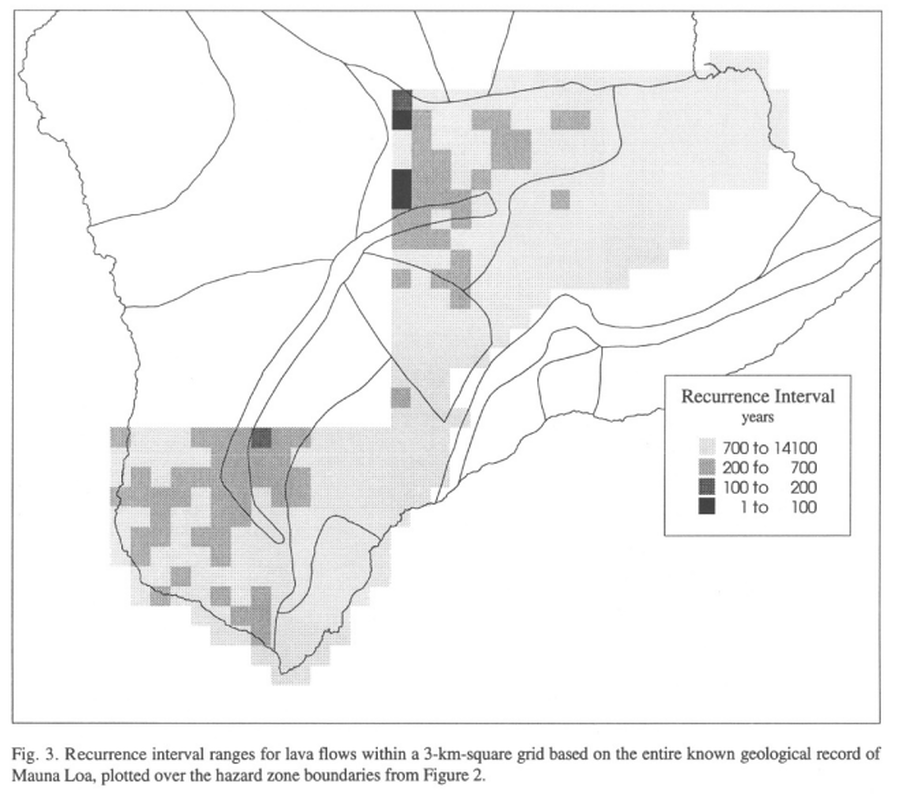
Recurrence interval ranges for lava flows within a 3-km-square grid based on the entire known geological record of Mauna Loa
Figure 3 in: Kauahikaua, J., Margriter, S., Lockwood, J., & Trusdell, F. (1995). Applications of GIS to the estimation of lava flow hazards on Mauna Loa Volcano, Hawai'i. Washington DC American Geophysical Union Geophysical Monograph Series, 92, 315-325. https://doi.org/10.1029/GM092p0315

Official, Figure in a journal article
Recurrence interval ranges for lava flows within a 3-km-square grid based on the geologic record of Mauna Loa from the last 150 years
Figure 4 in: Kauahikaua, J., Margriter, S., Lockwood, J., & Trusdell, F. (1995). Applications of GIS to the estimation of lava flow hazards on Mauna Loa Volcano, Hawai'i. Washington DC American Geophysical Union Geophysical Monograph Series, 92, 315-325. https://doi.org/10.1029/GM092p0315

Official, Figure in a journal article
Recurrence intervals for lava flows erupted between 1843 and the present within topographically-defined catchments
Figure 5 in: Kauahikaua, J., Margriter, S., Lockwood, J., & Trusdell, F. (1995). Applications of GIS to the estimation of lava flow hazards on Mauna Loa Volcano, Hawai'i. Washington DC American Geophysical Union Geophysical Monograph Series, 92, 315-325. https://doi.org/10.1029/GM092p0315
Official, Figure in hazard assessment
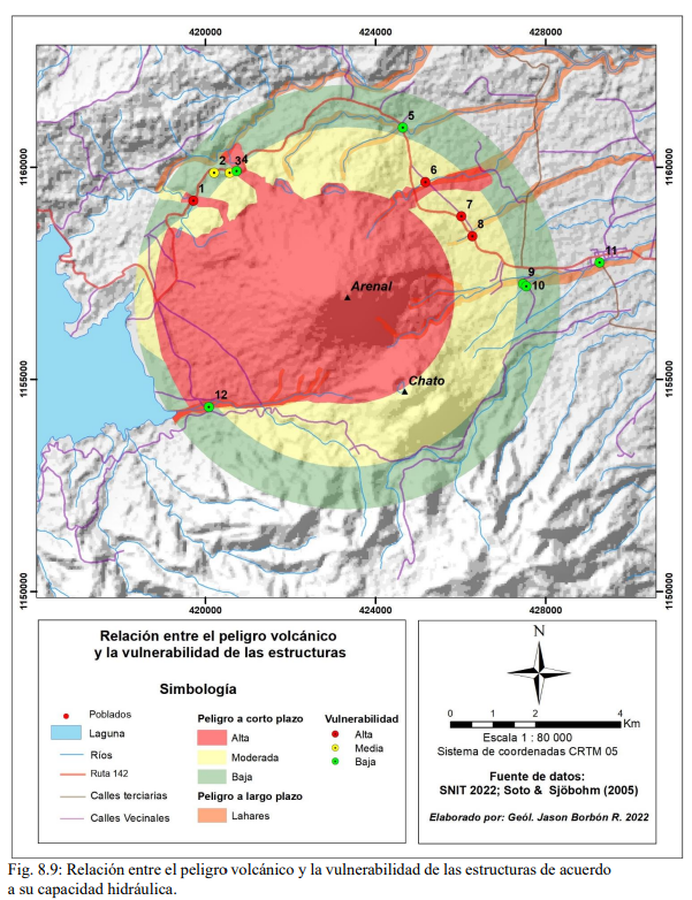
Relación entre el peligro volcánico y la vulnerabilidad de las estructuras
(Relationship between volcanic danger and the vulnerability of structures)
Figure 8.9 in: Alvarado, G.E., Brenes-André, F., Núñez, D., Borbón, J., Ramírez, M.A., Alpízar, Y., Núñez, S., Sibaja, J.P., Esquivel, L. (2023). Actualización del Análisis del Peligro Volcánico del Arenal, Costa Rica. Instituto Costarricense de Electricidad (ICE). Mayo 2023.
Official, Figure in hazard assessment
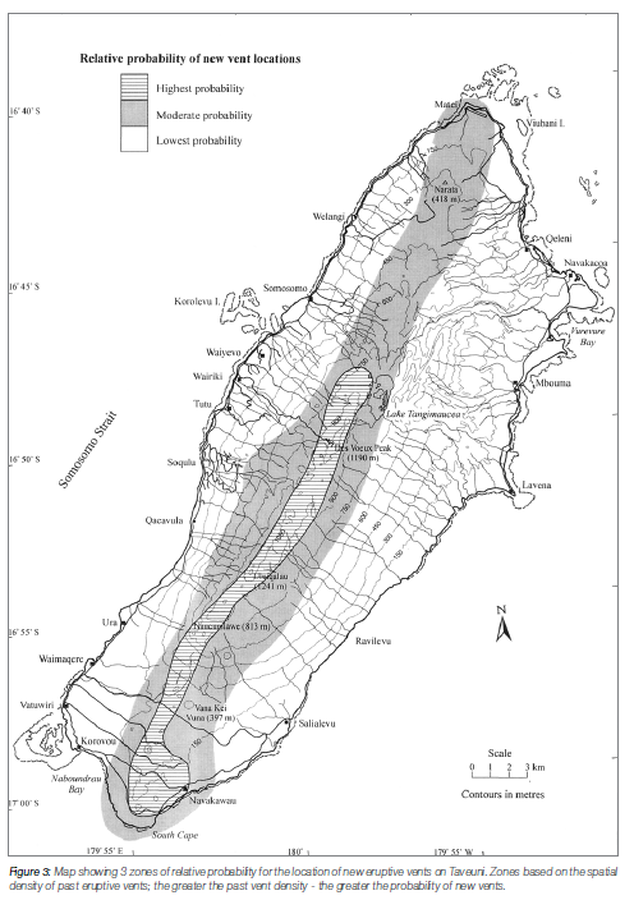
Relative probability of new vent locations
Figure 3 in: Cronin, S.J. (2016). Is There Volcanic Hazard In Fiji? Volcanic Geology Investigations On Taveuni. In: Taylor, P.W. (Ed.) Volcanic Hazards and Emergency Management in the Southwest Pacific, SPC Technical Bulletin, SPC00017, p. 170-178
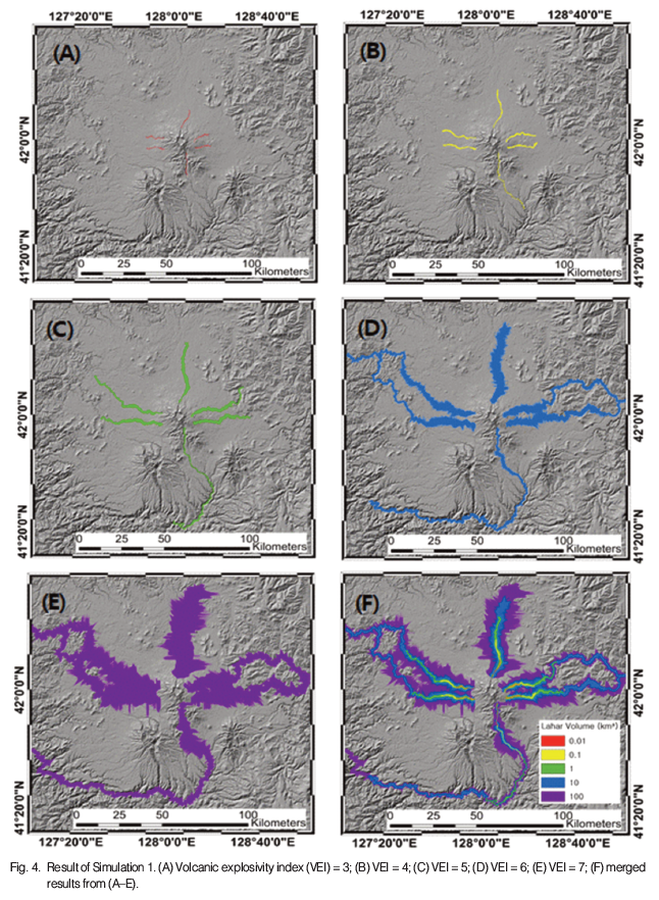
Figure in a journal article
Result of Simulation 1
Figure 4 in: Park, S.-J., & Lee, C.-W. (2018). Inundation Hazard Zone Created by Large Lahar Flow at the Baekdu Volcano Simulated using LAHARZ. Korean Journal of Remote Sensing, 34(1), 75–87. https://doi.org/10.7780/KJRS.2018.34.1.5
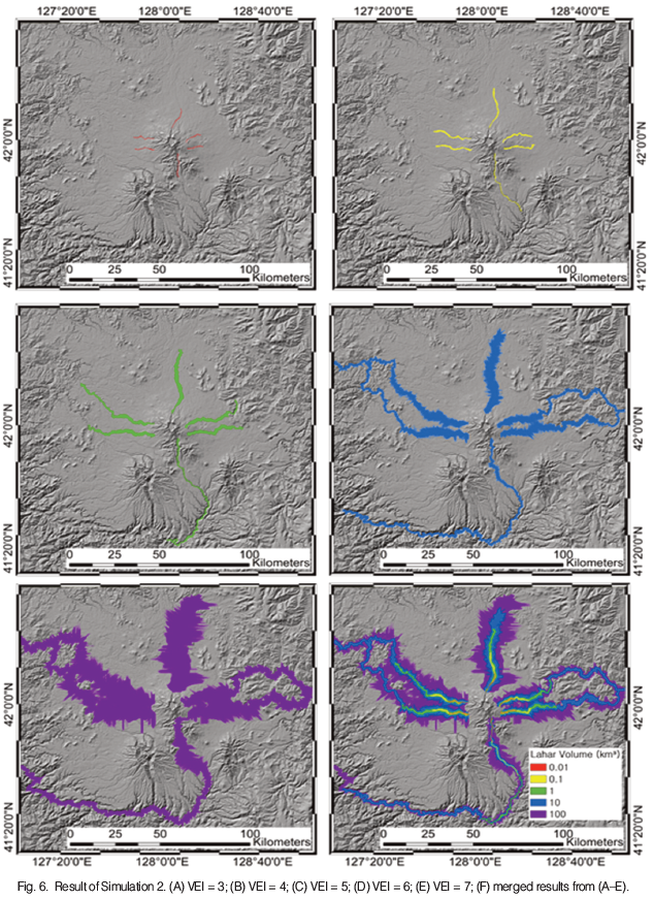
Figure in a journal article
Result of Simulation 2
Figure 6 in: Park, S.-J., & Lee, C.-W. (2018). Inundation Hazard Zone Created by Large Lahar Flow at the Baekdu Volcano Simulated using LAHARZ. Korean Journal of Remote Sensing, 34(1), 75–87. https://doi.org/10.7780/KJRS.2018.34.1.5
Official, Figure in hazard assessment
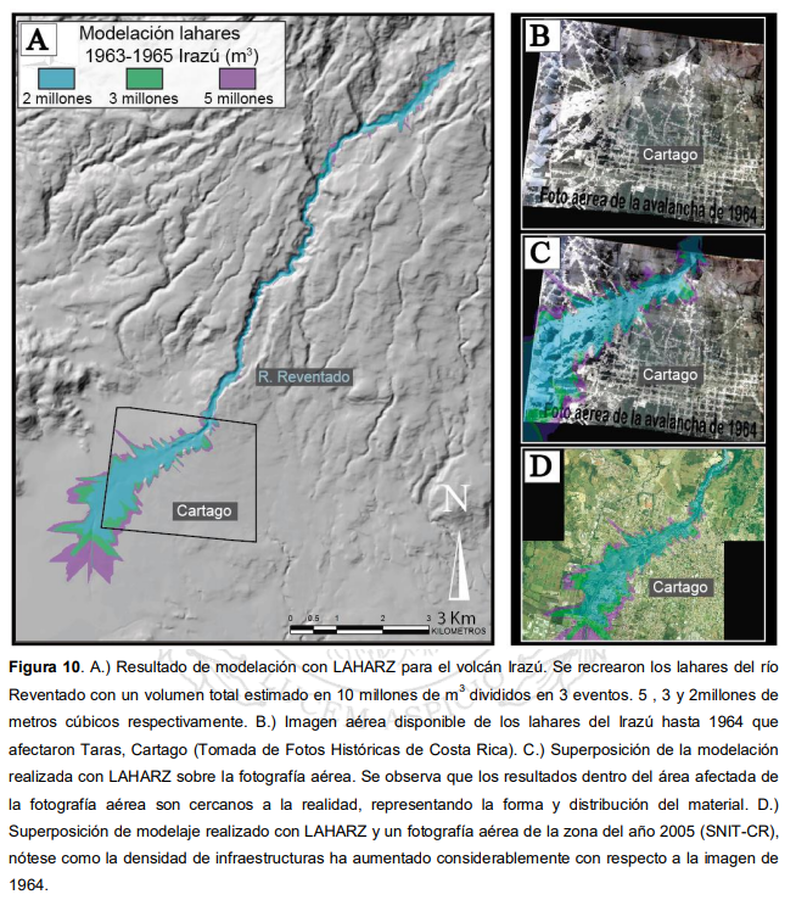
Resultado de modelación con LAHARZ para el volcán Irazú
(Modeling result with LAHARZ for the Irazú volcano)
Figure 10 in: Ruiz, P., Vega, P. & Barrantes, R. (2015). Modelación de lahares generados por el volcán Turrialba y su posible afectación a la red vial nacional. Laboratorio Nacional de Materiales y Modelos Estructurales. Universidad de Costa Rica 42 pp.
Official, Figure in hazard assessment
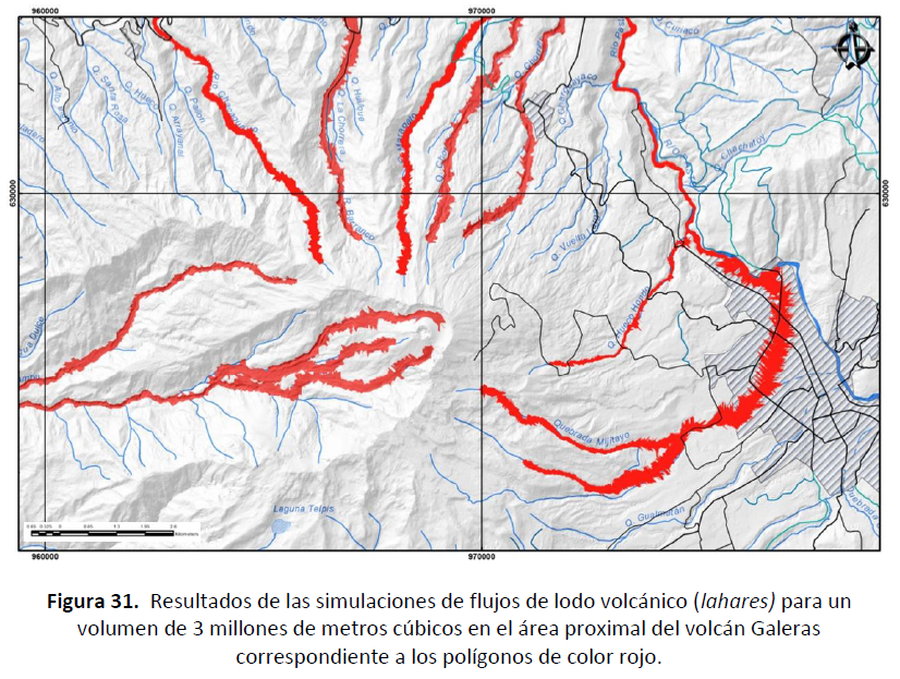
Resultados de las simulaciones de flujos de lodo volcánico (lahares) para un volumen de 3 millones de metros cúbicos en el área proximal del volcán Galeras correspondiente a los polígonos de color rojo.
(Results of the simulations of volcanic mud flows (lahars) for a volume of 3 million cubic meters in the proximal area of the Galeras volcano corresponding to the red polygons)
Figure 31 in: Servicio Geológico Colombiano (SGC) Direccion de Geoamenazas. (2015). Implementación de Herramientas Computacionales para la Simulación de Fenómenos Volcánicos, Como Soporte en la Actualización del Mapa de Amenaza del Volcánica Del Volcán Galeras – Colombia, Informe Técnico de Simulaciones. En cumplimiento a la Sentencia de la Corte Constitucional T-269 de 2015.