
Advanced Search for Maps
Showing 1601-1610 of 2217
Official, Figure in hazard assessment
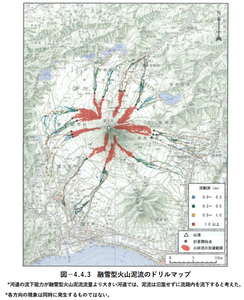
Scenario map of snow-melting lahar
Figure 4.4.3 in: Mt. Fuji Hazard Map Review Committee. (2004). Mt. Fuji Hazard Map Review Committee Report. June 2004. https://www.bousai.go.jp/kazan/fuji_map/pdf/report_200406.pdf
Official, Figure in a journal article
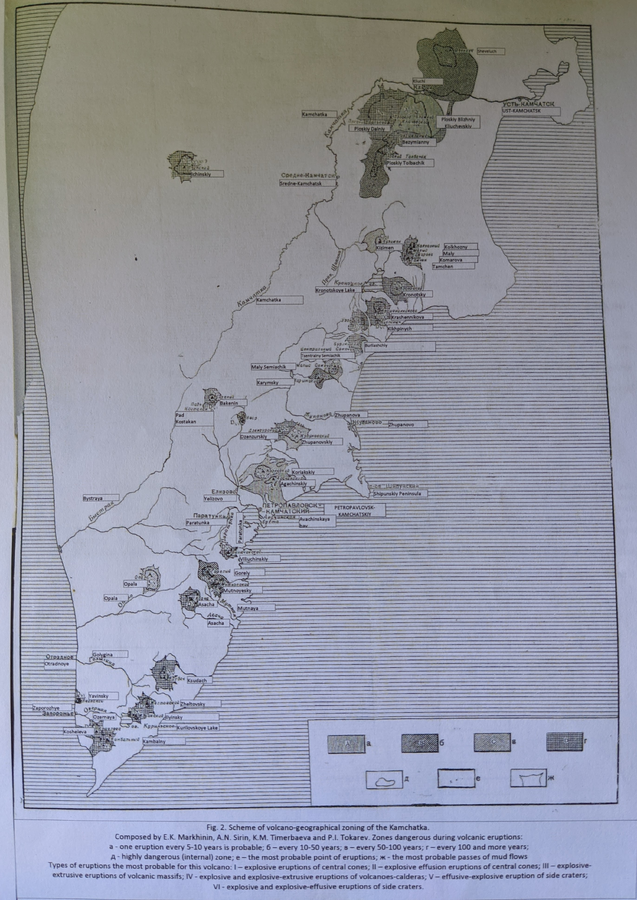
Scheme of volcano-geographical zoning in Kamchatka
Figure 2 in: Markhinin, E. K., Sirin, A. N., Timerbayeva, K. M., & Tokarev, P. I. (1962). Experience of volcanic-geographic zoning of Kamchatka and Kuril Islands. Bulletin of the Volcanological Station, Petropavlousk, Kamchatskiy, USSR, 32, 52-70.
Official, Figure in a journal article
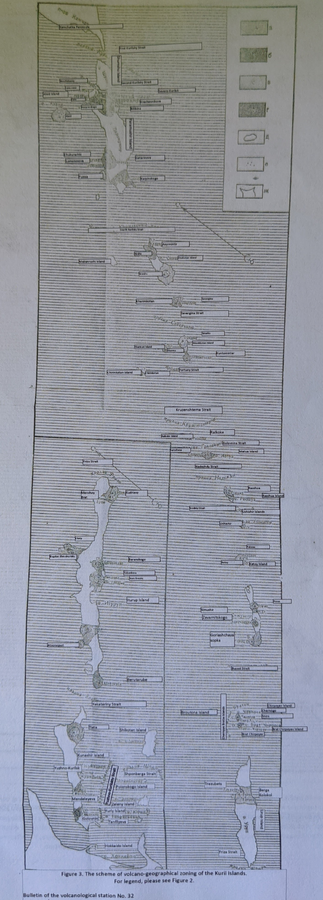
Scheme of volcano-geographical zoning in the Kuril Islands
Figure 3 in: Markhinin, E. K., Sirin, A. N., Timerbayeva, K. M., & Tokarev, P. I. (1962). Experience of volcanic-geographic zoning of Kamchatka and Kuril Islands. Bulletin of the Volcanological Station, Petropavlousk, Kamchatskiy, USSR, 32, 52-70.
Official, Figure in hazard assessment
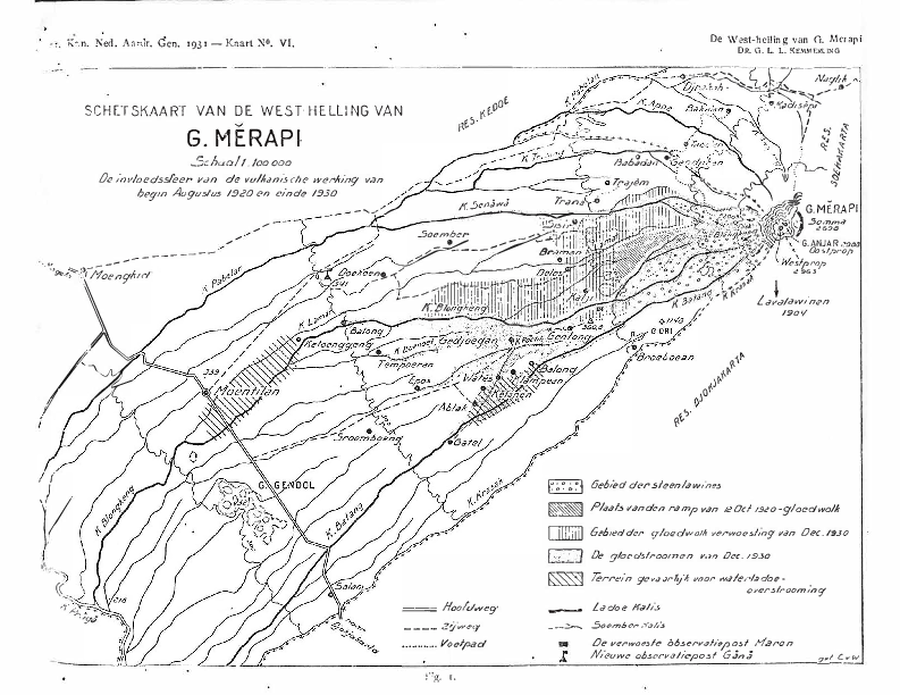
SCHETSKAART VAN DE WESTELIJKE HELLING VAN G. MERAPI. De invloedssfeer van de vulkanische activiteit van begin augustus 1920 tot eind 1930.
(Sketch map of the west slope of G. Merapi. The sphere of influence of the volcanic activity from early August 1920 and late 1930.)
Figure 1 in: Kemmerling, G. L. L. (1931). Beschouwingen over de hernieuwde werking van den Merapi der vorstenlanden van December 1930. Koninkl. Nederl. Aardrijksk. Genoot. Tijdschr, 48, 712-743.

Official, Insert/poster-size map with accompanying report
Schetskaart van een deel van de west-helling van G. Merapi. De invloedssfeer van de hernieuwde vulkanische werking van G. Merapi, sedert begin Augustus 1920.
(Sketch map of part of the western slope of Mount Merapi. The area of influence of Mount Merapi's renewed volcanic activity since early August 1920.)
Plate 1 in: Kemmerling, G. L. L. (1921). De hernieuwde werking van den vulkaan G. Merapi (Midden Java) van begin Augustus: 1920 tot en met einde Februari 1921. Vulkanologische Mededeelingen, No. 3.
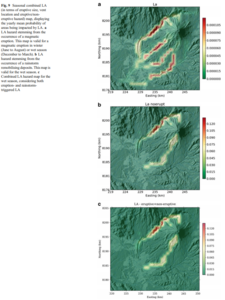
Figure in a journal article
Seasonal combined LA (in terms of eruptive size, vent location and eruptive/noneruptive hazard) map, displaying the yearly mean probability of areas being impacted by LA
Figure 9 in: Sandri, L., Thouret, J. C., Constantinescu, R., Biass, S., & Tonini, R. (2014). Long-term multi-hazard assessment for El Misti volcano (Peru). Bulletin of volcanology, 76(2), 771. https://doi.org/10.1007/s00445-013-0771-9
Official, Figure in hazard assessment
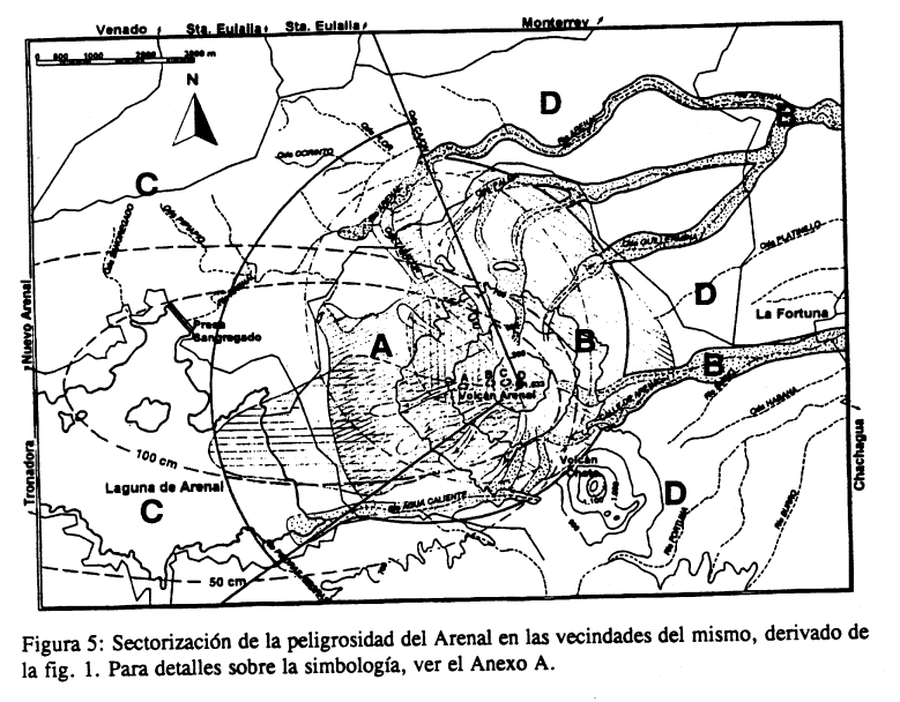
Sectorización de la peligrosidad del Arenal en las vecindades del mismo, derivado de la fig. 1
(Sectorization of the danger of Arenal in its vicinity, derived from fig. 1)
Figure 5 in: Alvarado, G.E., Soto, G.J., Ghigliotti, M., & Frullani, A. (1997). Peligro volcánico del Arenal. Boletín OSIVAM, 8(15-16), p. 62-82.
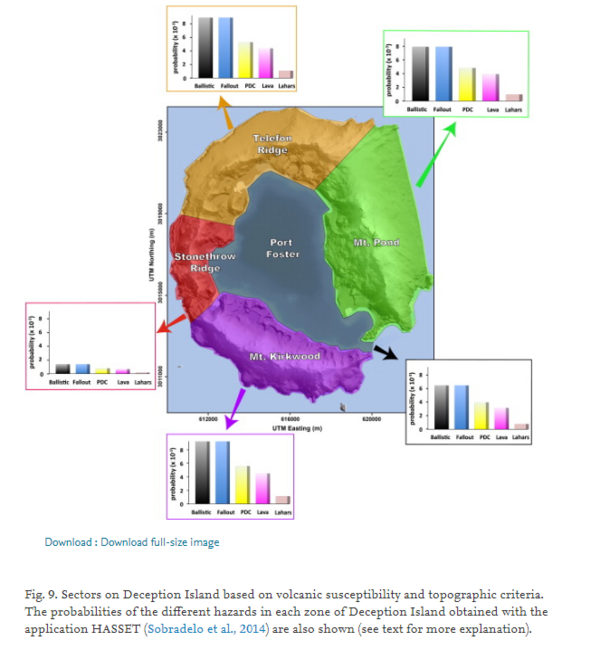
Figure in a journal article
Sectors on Deception Island based on volcanic susceptibility and topographic criteria.
Figure 9 in: Bartolini, S., Geyer, A., Martí, J., Pedrazzi, D., & Aguirre-Díaz, G. (2014). Volcanic hazard on Deception Island (South Shetland Islands, Antarctica). Journal of Volcanology and Geothermal Research, 285, p. 150-168. https://doi.org/10.1016/j.jvolgeores.2014.08.009
Official, Figure in hazard assessment
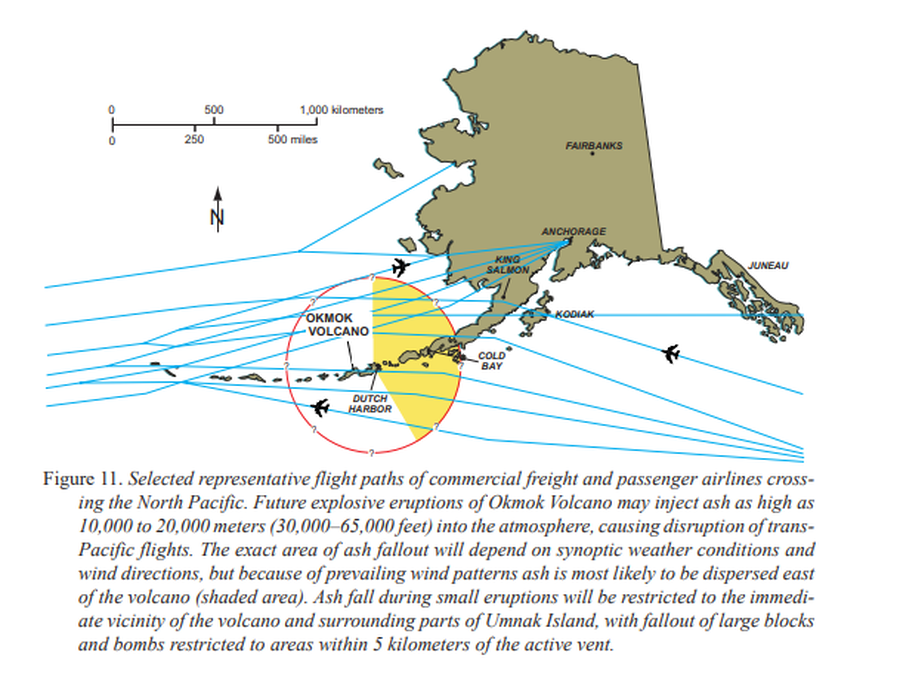
Selected representative flight paths of commercial freight and passenger airlines crossing the North Pacific
Figure 11 in: Beget, J.E., Larsen, J.F., Neal, C.A., Nye, C.J., & Schaefer, J.R. (2005). Preliminary volcano-hazard assessment for Okmok Volcano, Umnak Island, Alaska. Department of Natural Resources, Division of Geological & Geophysical Surveys (DGGS), Report of Investigation RI 2004-3, 32 p., 1 sheet, scale 1:150,000. http://doi.org/10.14509/7042
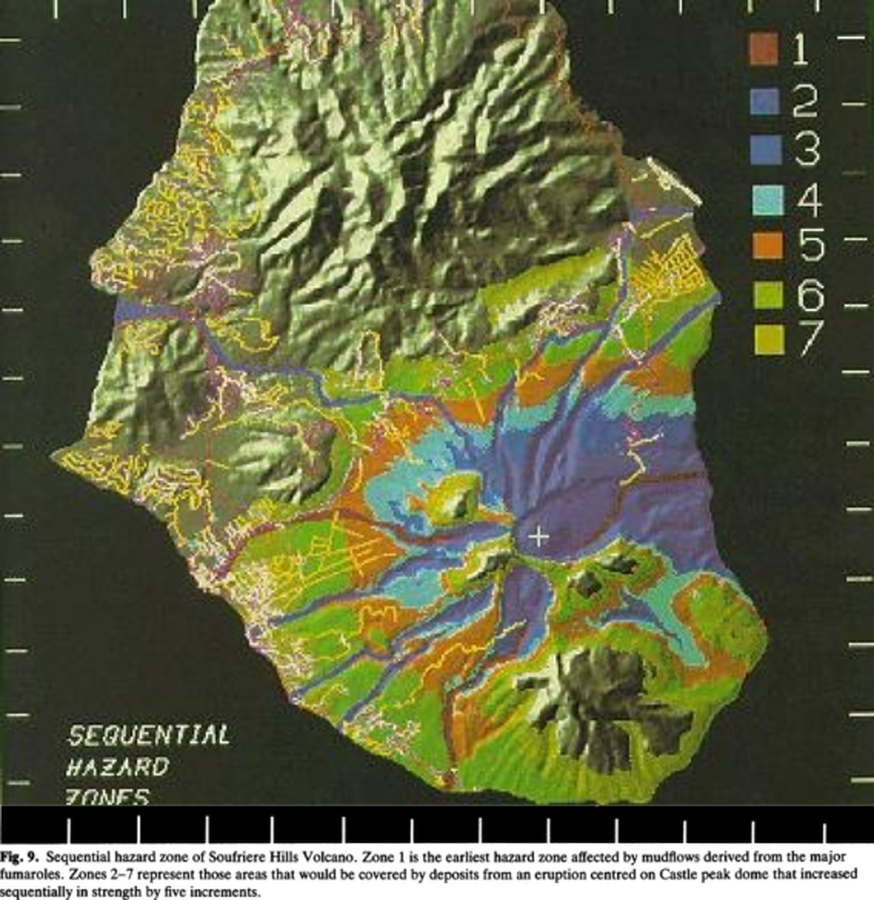
Figure in a journal article
Sequential hazard zoneof Soufriere Hills Volcano
Figure 9 in: Wadge, G. & Isaacs, M. C. (1988). Mapping the volcanic hazards from Soufriere Hills Volcano, Montserrat, West Indies using an image processor. Journal of the Geological Society, 145 (4) 541-551. https://doi.org/10.1144/gsjgs.145.4.0541