
Advanced Search for Maps
Showing 21-30 of 141
Official, Figure in hazard assessment
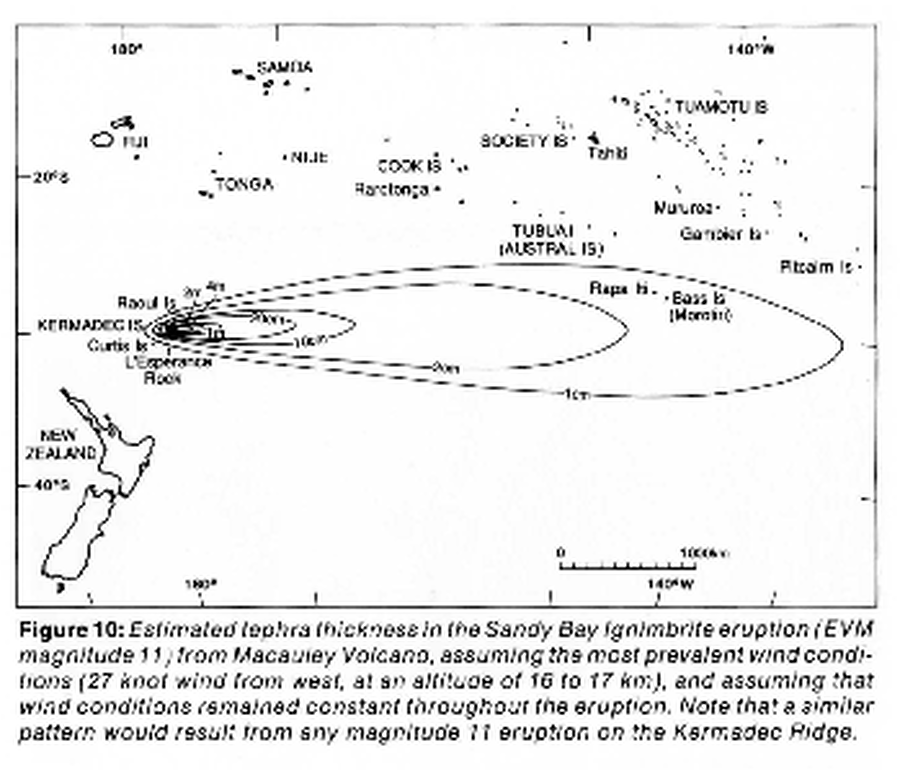
Estimated tephra thickness in the Sandy Bay Ignimbrite eruption
Figure 10 in: Latter, J. H., Lloyd, E. F., Smith, I. E. M., Nathan, S. (1992). Volcanic Hazards in the Kermadec Islands, and at Submarine Volcanoes between Southern Tonga and New Zealand. Volcanic Hazards Information Series No. 4. Volcanic Hazards Working Group of the Scientific Advisory Committee, Ministry of Civil Defence. pp. 44.
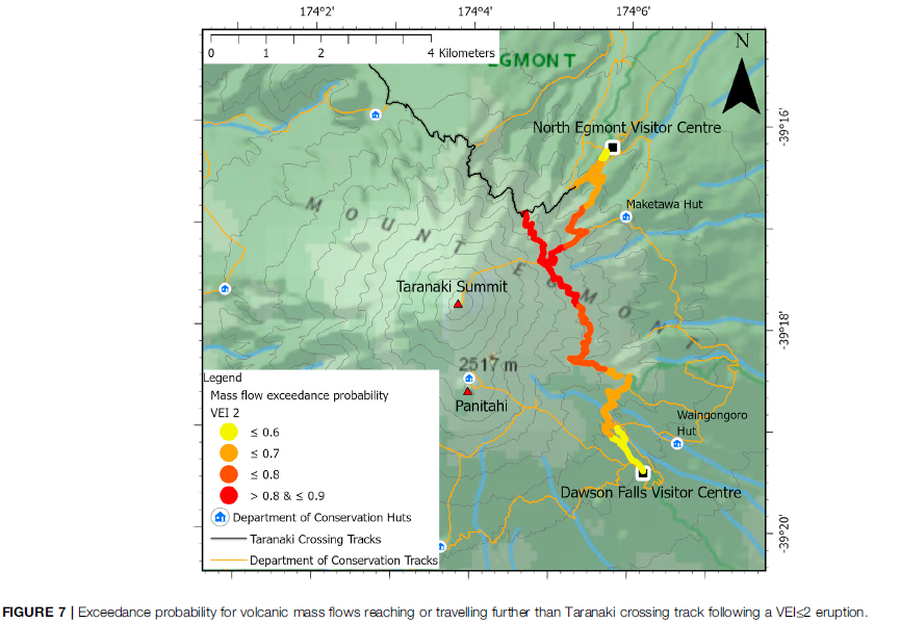
Figure in a journal article
Exceedance probability for volcanic mass flows reaching or travelling further than Taranaki crossing track following a VEI≤2 eruption
Figure 7 in: Mead, S., Procter, J., Bebbington, M., & Rodriguez-Gomez, C. (2022). Probabilistic Volcanic Hazard Assessment for National Park Infrastructure Proximal to Taranaki Volcano (New Zealand). Frontiers in Earth Science, 435. https://doi.org/10.3389/feart.2022.832531
Official, Figure in hazard assessment
Ground Deformation Hazard Zone
Figure 10 in: Hackett, W.R. & Smith, R.P. (1994). Volcanic hazards of the Idaho National Engineering Laboratory and adjacent areas (No. INEL--94/0276). Lockheed Martin Idaho Technologies Co..
Official, Figure in hazard assessment
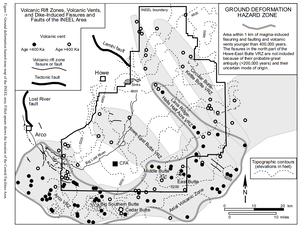
Ground Deformation Hazard Zone
Figure 7 in: Hackett, W.R., Smith, R.P., & Khericha, S. (2002). Volcanic hazards of the Idaho National Engineering and Environmental Laboratory, southeast Idaho. In: Bonnichsen, B., White, C.M., and McCurry, M. (eds.). Tectonic and Magmatic Evolution of the Snake River Plain Volcanic Province. Idaho Geological Survey Bulletin 30, p. 461-482.
Official, Unknown format
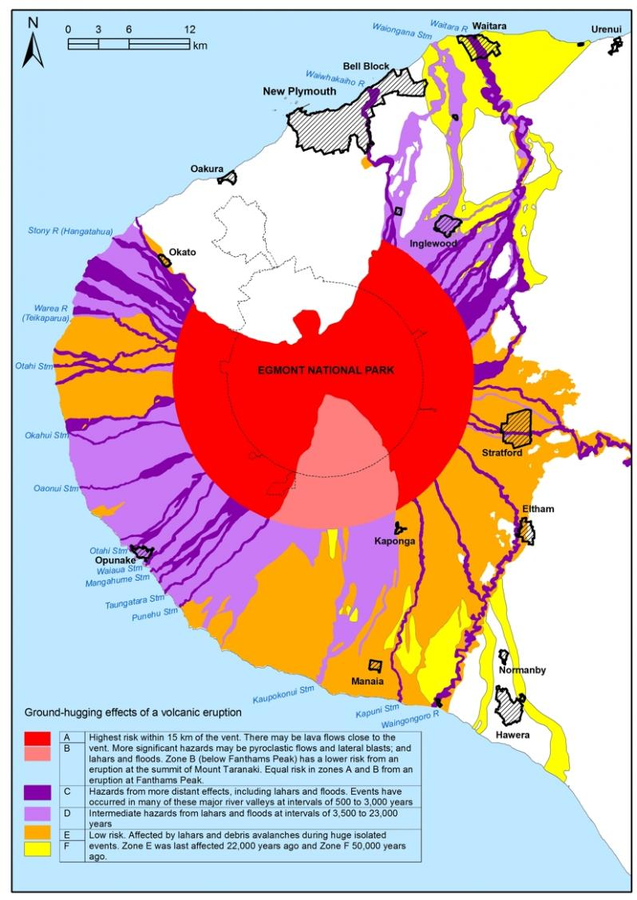
Ground hugging effects of a volcanic eruption
Taranaki Regional Council. (2004). Civil Defence Emergency Management, Group Plan for Taranaki. Stratford.
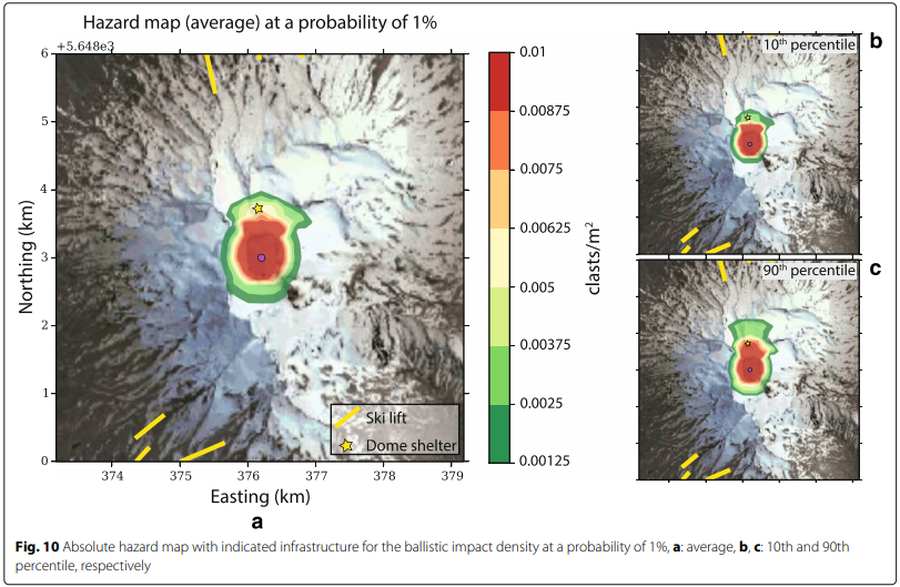
Figure in a journal article
Hazard map (average) at a probability of 1%
Figure 10 in: Strehlow, K., Sandri, L., Gottsmann, J. H., Kilgour, G., Rust, A. C., & Tonini, R. (2017). Phreatic eruptions at crater lakes: occurrence statistics and probabilistic hazard forecast. Journal of Applied Volcanology, 6(1), 4. https://doi.org/10.1186/s13617-016-0053-2
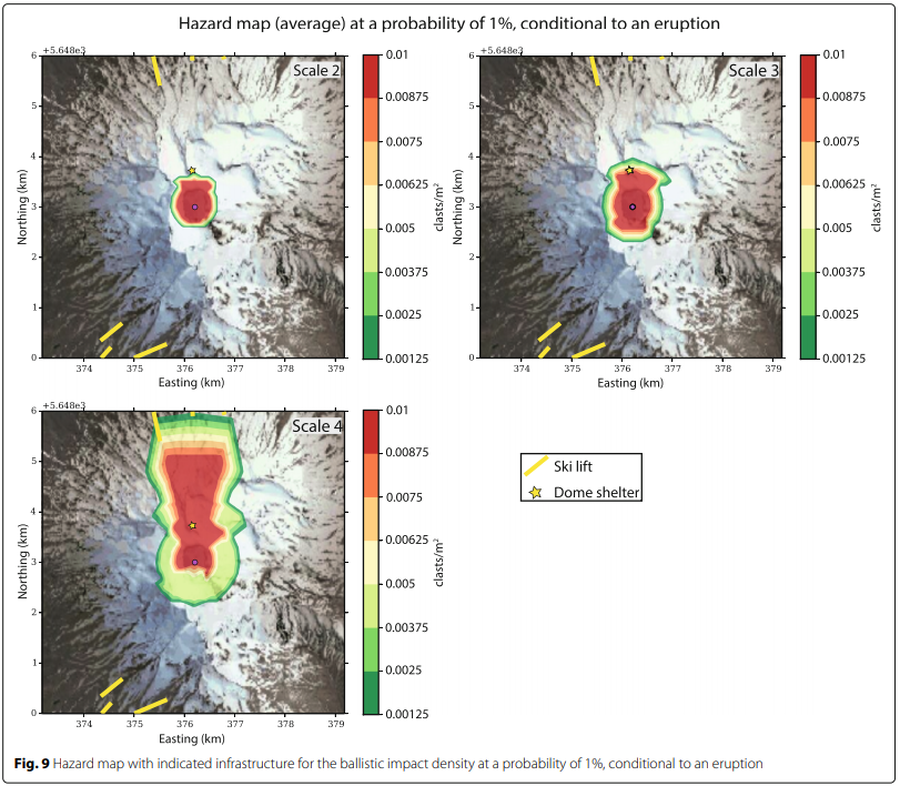
Figure in a journal article
Hazard map (average) at a probability of 1% conditional to an eruption
Figure 9 in: Strehlow, K., Sandri, L., Gottsmann, J. H., Kilgour, G., Rust, A. C., & Tonini, R. (2017). Phreatic eruptions at crater lakes: occurrence statistics and probabilistic hazard forecast. Journal of Applied Volcanology, 6(1), 4. https://doi.org/10.1186/s13617-016-0053-2
Official, Figure in hazard assessment
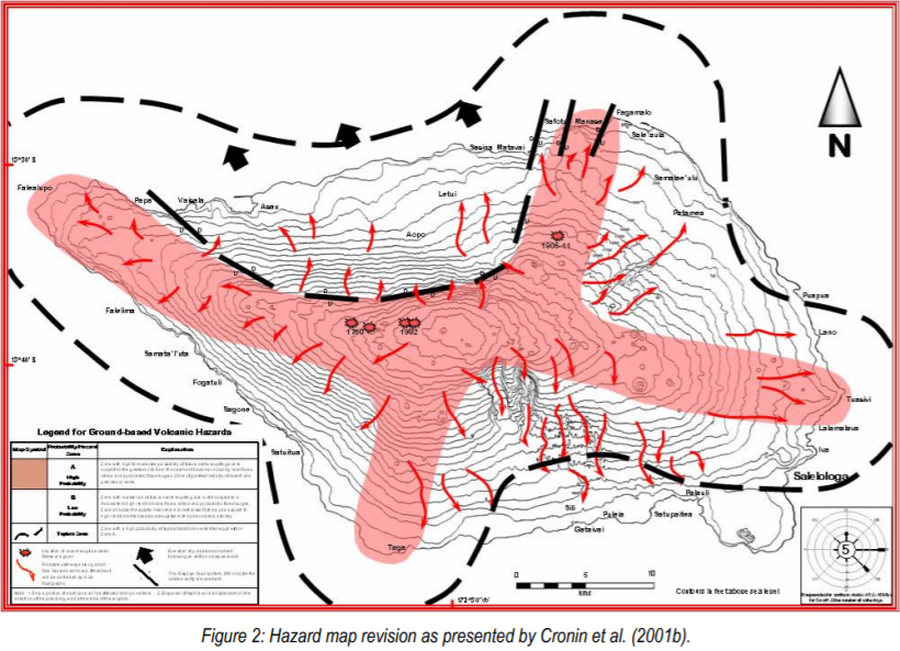
Hazard map revision as presented by Cronin et al. (2001b)
Figure 2 in: Cronin, S., Bonte-Grapentin, M. & Nemeth, K. (2006). Samoa technical report - Review of volcanic hazard maps for Savai'i and Upolu. Pacific Islands Applied Geoscience Commission (SOPAC) Project Report 59.
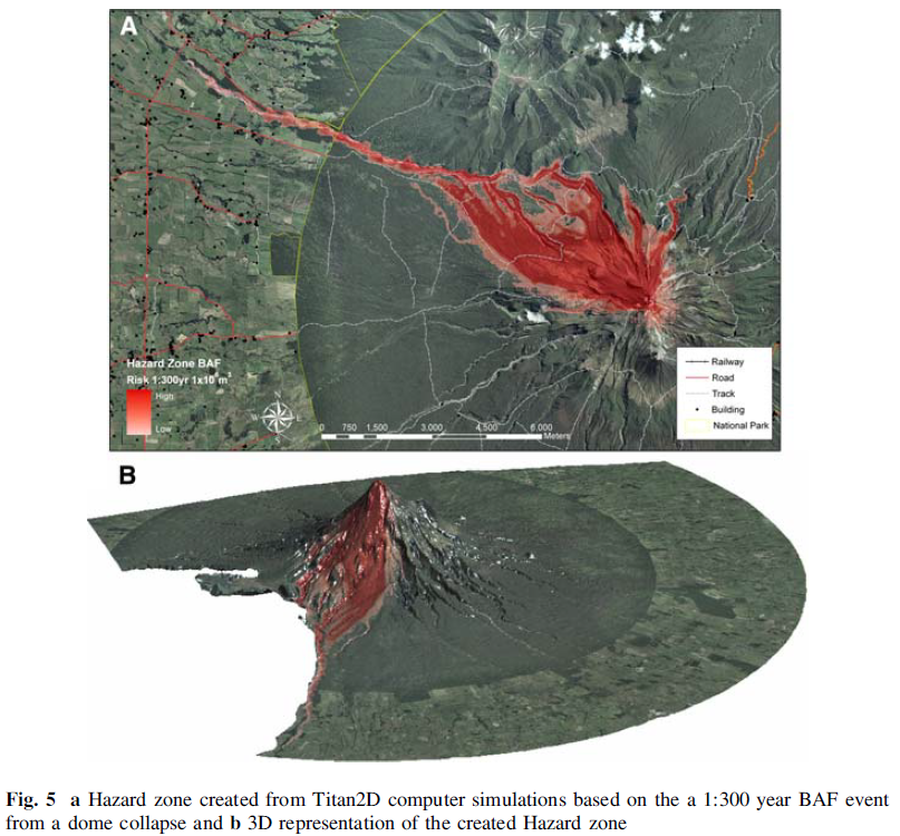
Figure in a journal article
Hazard zone created from Titan2D computer simulations based on the 1:300 year BAF event from a dome collapse and 3D representation of the created Hazard zone
Figure 5 in: Procter, J. N., Cronin, S. J., Platz, T., Patra, A., Dalbey, K., Sheridan, M., & Neall, V. (2010). Mapping block-and-ash flow hazards based on Titan 2D simulations: a case study from Mt. Taranaki, NZ. Natural Hazards, 53, 483-501.
Official, Figure in hazard assessment
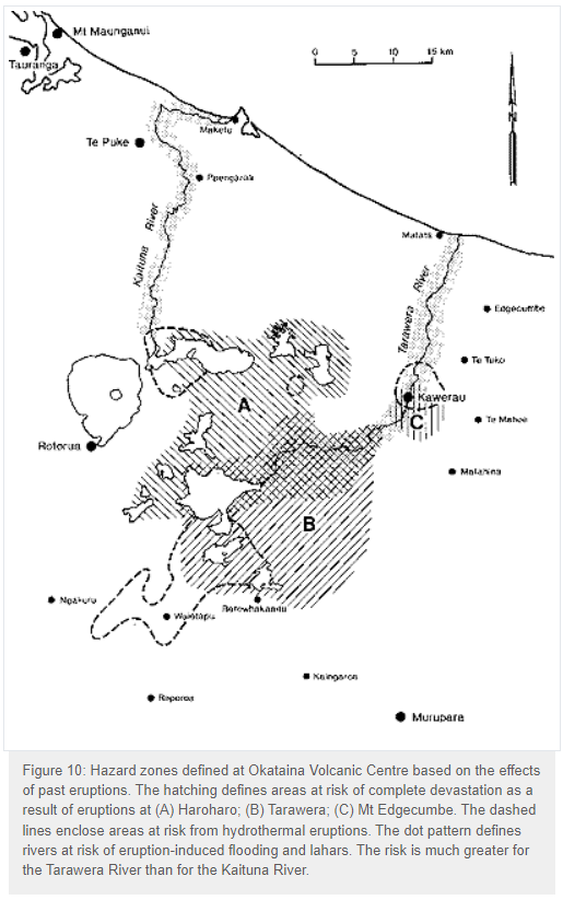
Hazard zones defined at Okataina Volcanic Centre based on the effects of past eruptions
Figure 10 in: Nairn, I.A. (1993). Volcanic hazards at Okataina Centre. 3rd ed. Ministry of Civil Defence, Palmerston North, NZ. Volcanic hazards information series 2. 29 p. Reproduced on website: https://www.gns.cri.nz/Home/Learning/Science-Topics/Volcanoes/New-Zealand-Volcanoes/Volcano-Geology-and-Hazards/Okataina-Volcanic-Centre-Geology