
Advanced Search for Maps
Showing 61-70 of 92
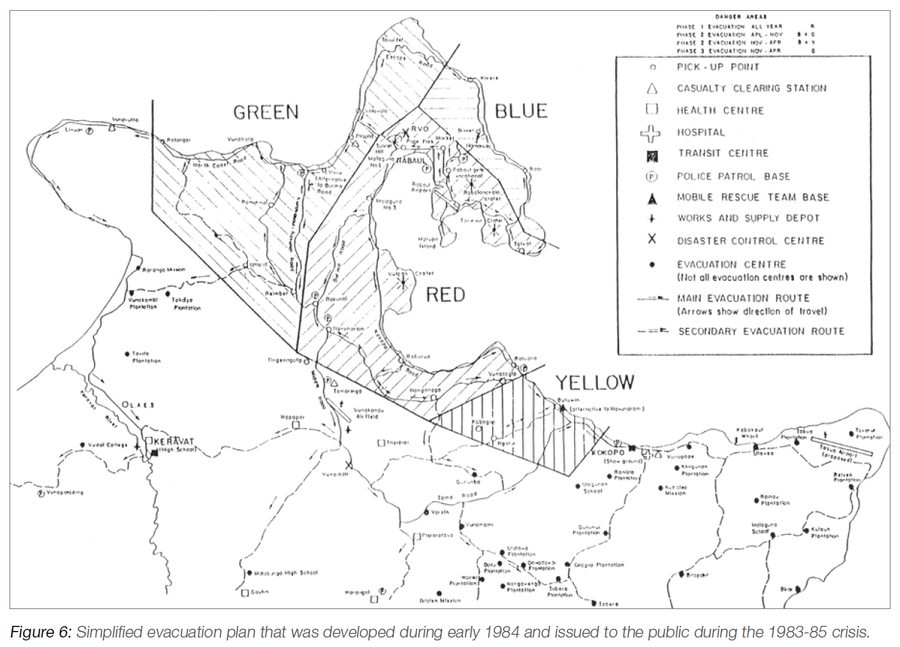
Official, Figure in hazard assessment
Simplified evacuation plan that was developed during early 1984 and issued to the public during the 1983-85 crisis
Figure 6 (in reprint) in: RVO. (1984). (Reprinted in: Talai, B. (2016). Volcanic Crises Case Histories Rabaul Volcano, 1983-85, 1994-97. In: Taylor, P.W. (Ed.) Volcanic Hazards and Emergency Management in the Southwest Pacific, SPC Technical Bulletin, SPC00017, p. 110-118)
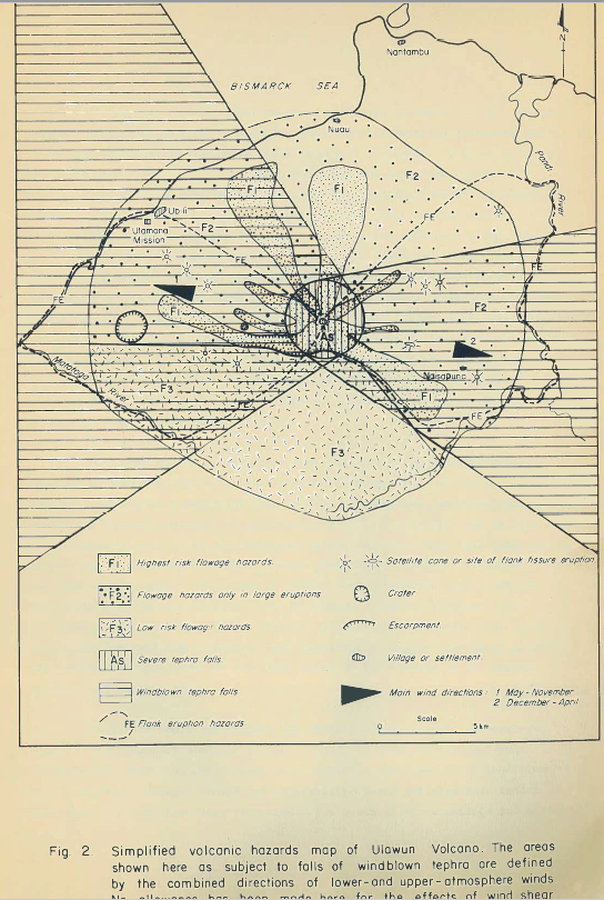
Official, Figure in hazard assessment
Simplified volcanic hazards map of Ulawun Volcano
Figure 2 in: McKee, C.O. (1983). Volcanic hazards at Uluwan volcano. Geological Survey of Papua New Guinea, Report 83/13, 1:100,000
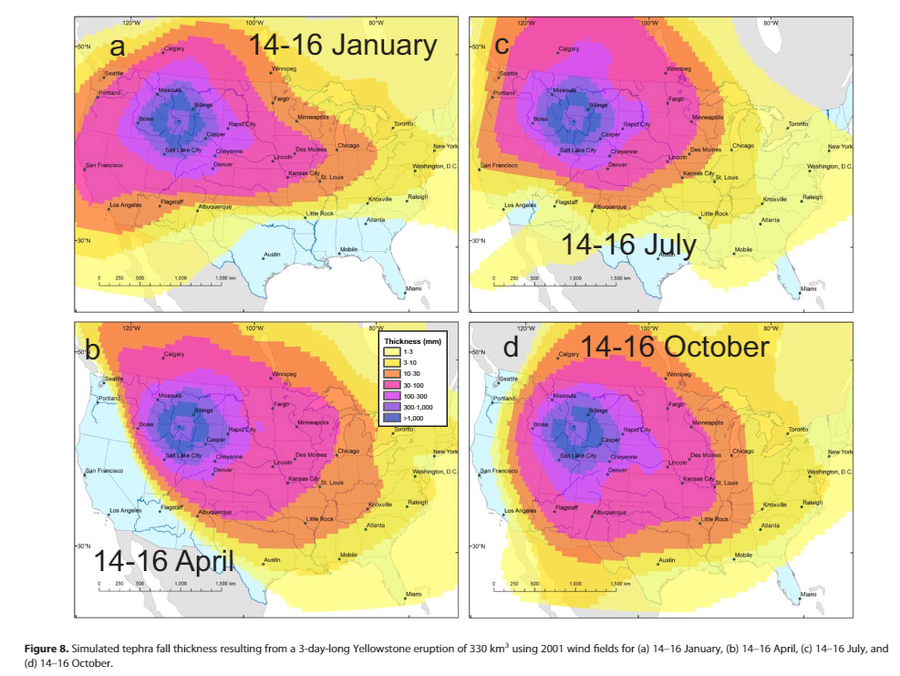
Official, Figure in a journal article
Simulated tephra fall thickness resulting from a 3-day-long Yellowstone eruption of 330 km³ using 2001 wind fields for (a) 14–16 January, (b) 14–16 April, (c) 14–16 July, and(d) 14–16 October.
Figure 8 in: Mastin, L.G., Van Eaton, A.R., & Lowenstern, J.B. (2014). Modeling ash fall distribution from a Yellowstone supereruption. Geochemistry, Geophysics, Geosystems, 15(8), 3459-3475. https://doi.org/10.1002/2014GC005469
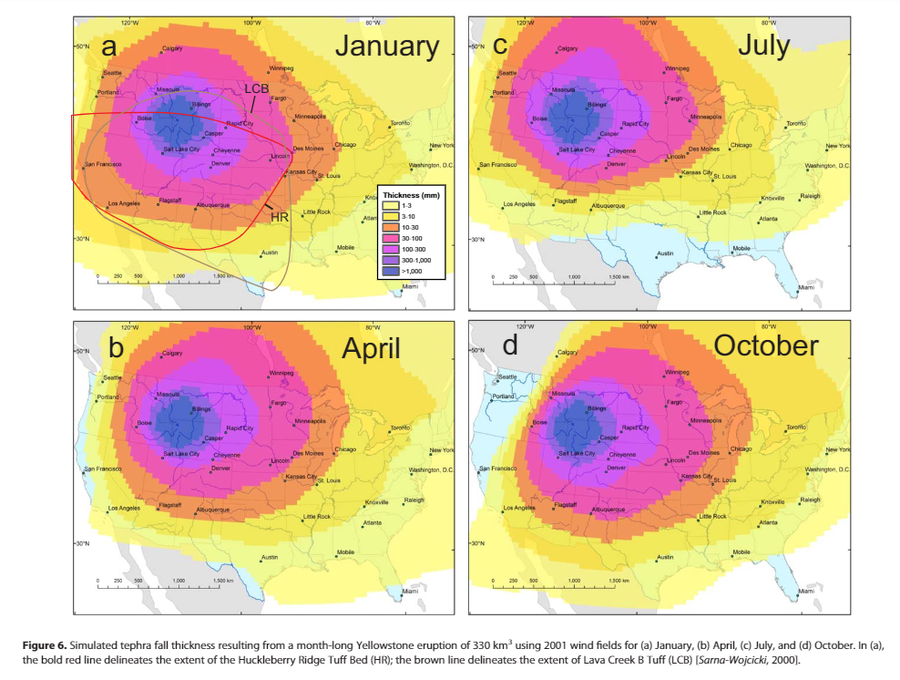
Official, Figure in a journal article
Simulated tephra fall thickness resulting from a month-long Yellowstone eruption of 330 km³ using 2001 wind fields for (a) January, (b) April, (c) July, and (d) October.
Figure 6 in: Mastin, L.G., Van Eaton, A.R., & Lowenstern, J.B. (2014). Modeling ash fall distribution from a Yellowstone supereruption. Geochemistry, Geophysics, Geosystems, 15(8), 3459-3475. https://doi.org/10.1002/2014GC005469
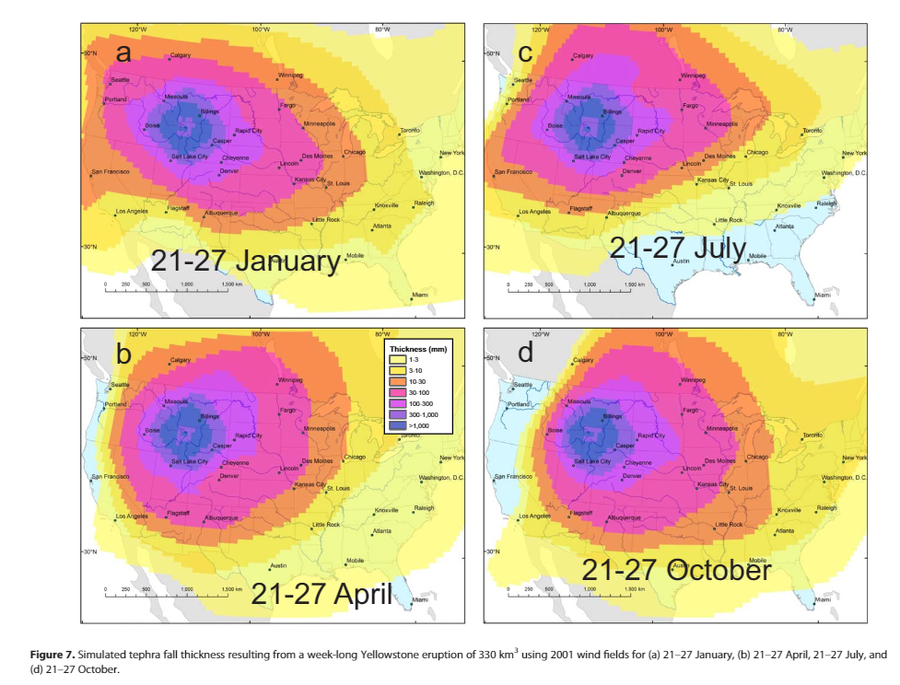
Official, Figure in a journal article
Simulated tephra fall thickness resulting from a week-long Yellowstone eruption of 330 km³ using 2001 wind fields for (a) 21–27 January, (b) 21–27 April, 21–27 July, and(d) 21–27 October.
Figure 7 in: Mastin, L.G., Van Eaton, A.R., & Lowenstern, J.B. (2014). Modeling ash fall distribution from a Yellowstone supereruption. Geochemistry, Geophysics, Geosystems, 15(8), 3459-3475. https://doi.org/10.1002/2014GC005469
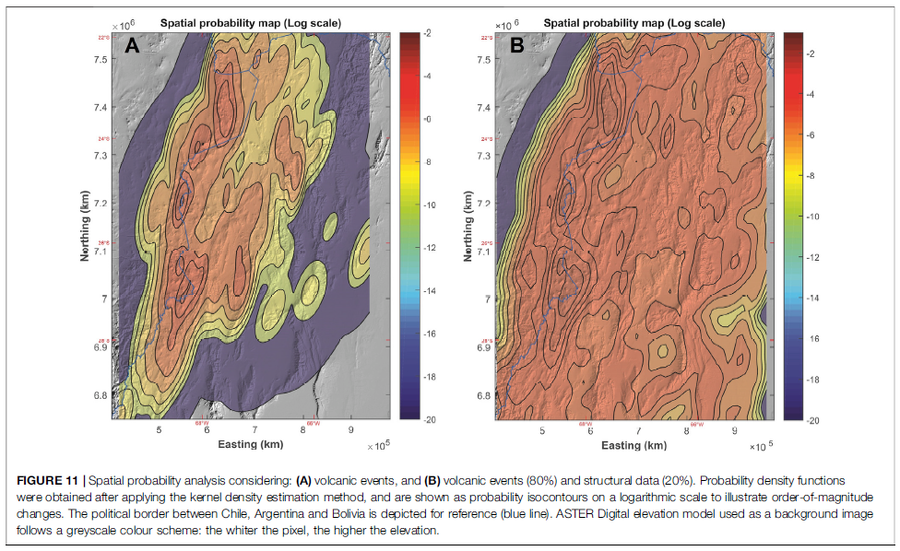
Figure in a journal article
Spatial probability analysis considering: (A) volcanic events, and (B) volcanic events (80%) and structural data (20%)
Figure 11 in: Bertin, D., Lindsay, J.M., Cronin, S.J., de Silva, S.L., Connor, C.B., Caffe, P.J., Grosse, P., Báez, W., Bustos, E., & Constantinescu, R. (2022). Probabilistic Volcanic Hazard Assessment of the 22.5–28° S Segment of the Central Volcanic Zone of the Andes. Frontiers in Earth Science, 10. https://doi.org/10.3389/feart.2022.875439
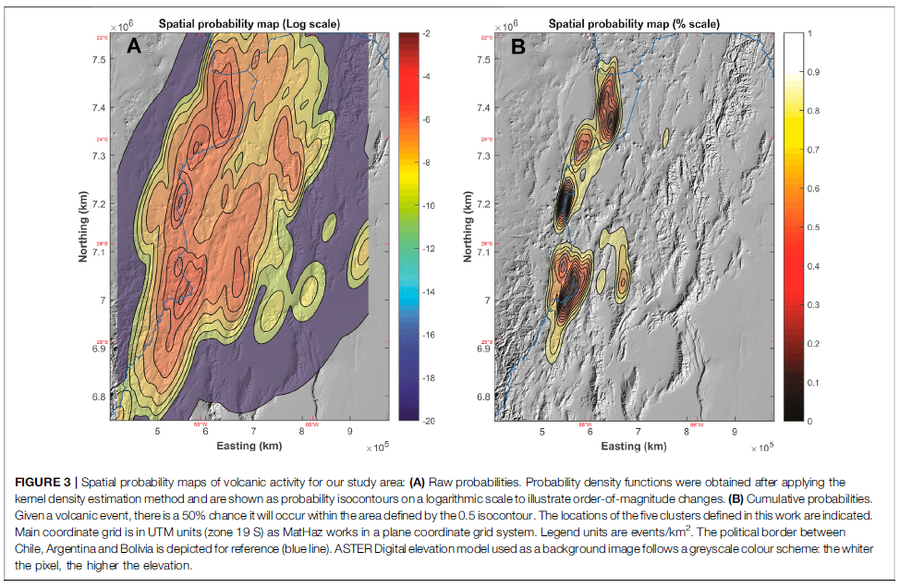
Figure in a journal article
Spatial probability maps of volcanic activity for our study area
Figure 3 in: Bertin, D., Lindsay, J.M., Cronin, S.J., de Silva, S.L., Connor, C.B., Caffe, P.J., Grosse, P., Báez, W., Bustos, E., & Constantinescu, R. (2022). Probabilistic Volcanic Hazard Assessment of the 22.5–28° S Segment of the Central Volcanic Zone of the Andes. Frontiers in Earth Science, 10. https://doi.org/10.3389/feart.2022.875439
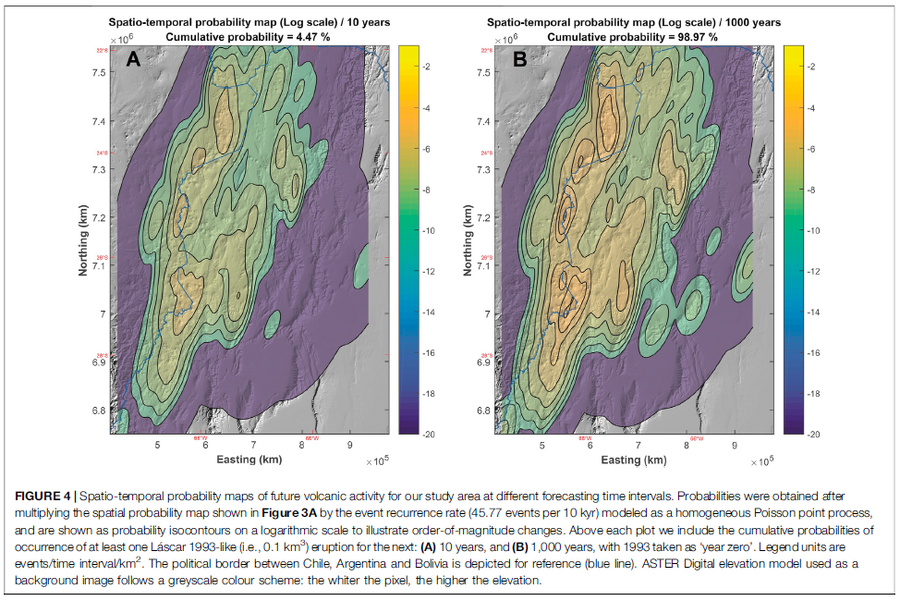
Figure in a journal article
Spatio-temporal probability maps of future volcanic activity for our study area at different forecasting time intervals
Figure 4 in: Bertin, D., Lindsay, J.M., Cronin, S.J., de Silva, S.L., Connor, C.B., Caffe, P.J., Grosse, P., Báez, W., Bustos, E., & Constantinescu, R. (2022). Probabilistic Volcanic Hazard Assessment of the 22.5–28° S Segment of the Central Volcanic Zone of the Andes. Frontiers in Earth Science, 10. https://doi.org/10.3389/feart.2022.875439

Official, Map sheet or poster
Tanna Communities Safety Map
Vanuatu Meteorology & Geo-Hazards Department. (2016). Tanna Communities Safety Map. Government of Vanuatu, Vanuatu Meteorology & Geo-Hazards Department, Vanuatu National Disaster Risk Management Office, New Zealand Foreign Affairs & Trade Aid Programme, GNS Science.
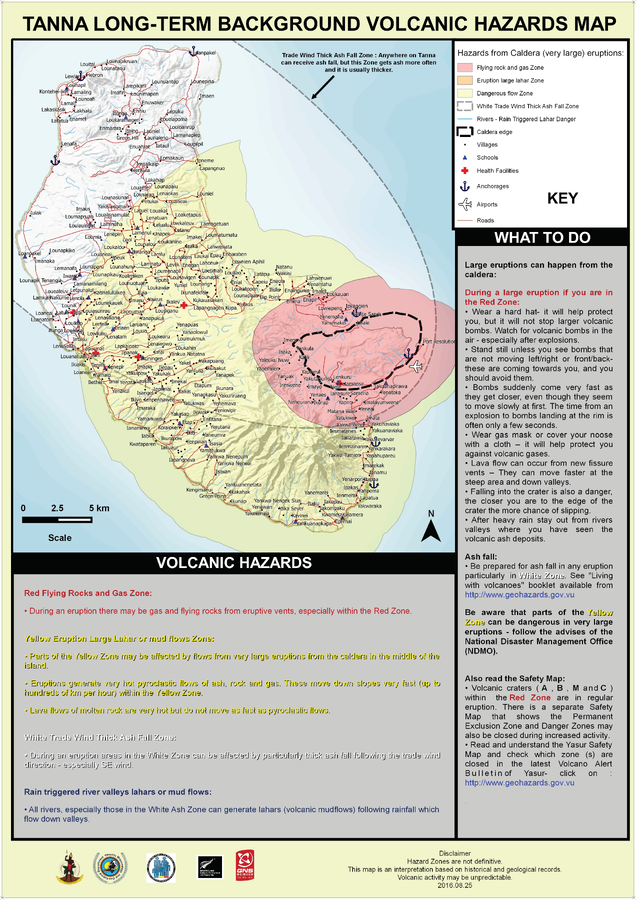
Official, Map sheet or poster
Tanna Long-Term Background Volcanic Hazards Map
Vanuatu Meteorology & Geo-Hazards Department. (2016). Tanna Long-Term Background Volcanic Hazards Map. Government of Vanuatu, Vanuatu Meteorology & Geo-Hazards Department, Vanuatu National Disaster Risk Management Office, New Zealand Foreign Affairs & Trade Aid Programme, GNS Science.