
Advanced Search for Maps
Showing 1-10 of 1482
Official, Figure in a journal article
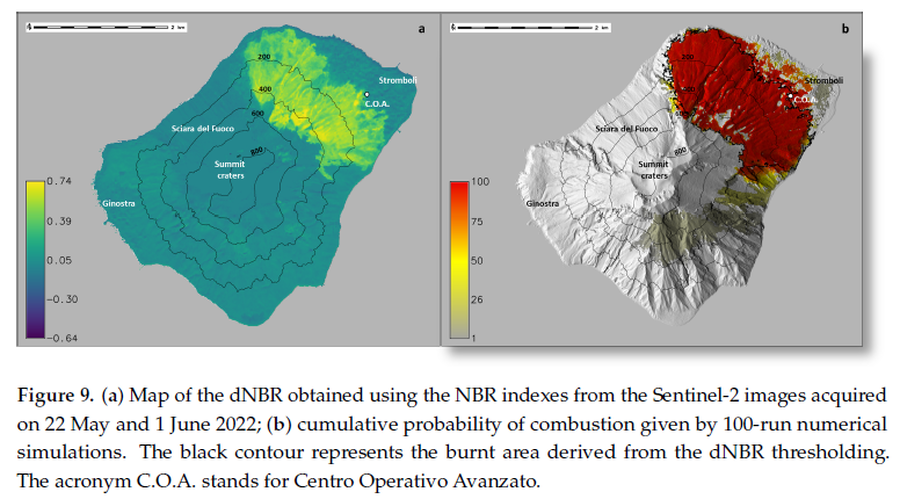
(a) Map of the dNBR obtained using the NBR indexes from the Sentinel-2 images acquired on 22 May and 1 June 2022; (b) cumulative probability of combustion given by 100-run numerical simulations
Figure 9 in: Guardo, R., Bilotta, G., Ganci, G., Zuccarello, F., Andronico, D., & Cappello, A. (2024). Modeling Fire Hazards Induced by Volcanic Eruptions: The Case of Stromboli (Italy). Fire, 7(3), 70.
Official, Figure in a journal article
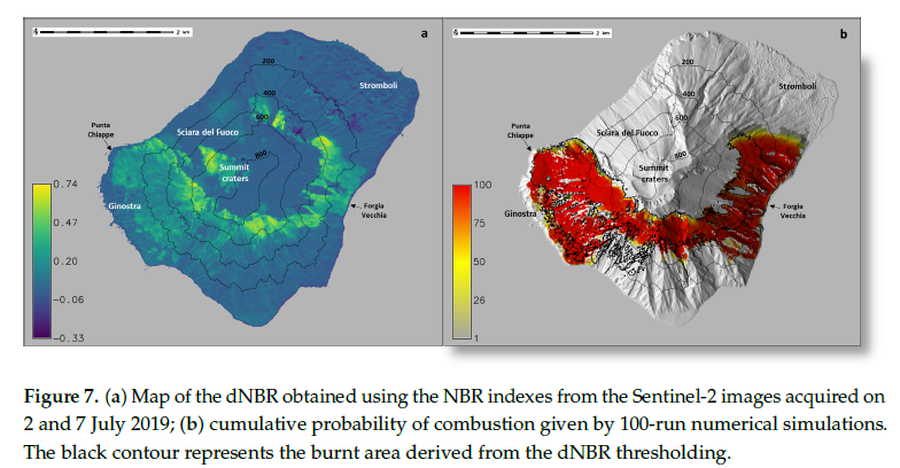
(a) Map of the dNBR obtained using the NBR indexes from the Sentinel-2 images acquired on 2 and 7 July 2019; (b) cumulative probability of combustion given by 100-run numerical simulations
Figure 7 in: Guardo, R., Bilotta, G., Ganci, G., Zuccarello, F., Andronico, D., & Cappello, A. (2024). Modeling Fire Hazards Induced by Volcanic Eruptions: The Case of Stromboli (Italy). Fire, 7(3), 70.
Official, Map sheet or poster
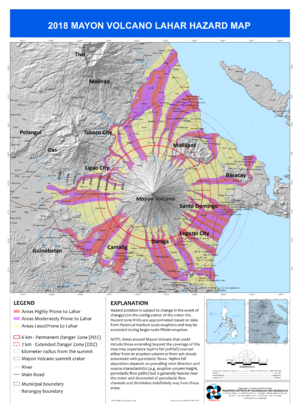
2018 Mayon Volcano Lahar Hazard Map
Philippine Institute of Volcanology and Seismology (PHIVOLCS). (2018). 2018 Mayon Volcano Lahar Hazard Map.
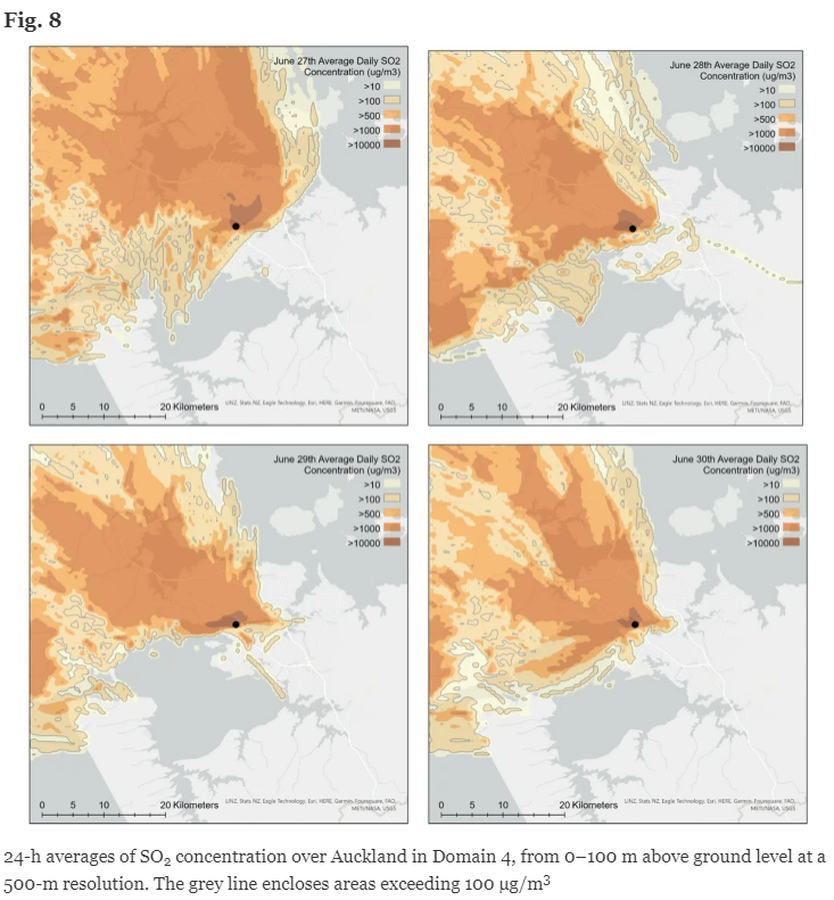
Figure in a journal article
24-h averages of SO2 concentration over Auckland in Domain 4, from 0–100 m above ground level at a 500-m resolution
Figure 8 in: Brody-Heine, S., Katurji, M., Stewart, C., Wilson, T., Smid, E. R., & Trancoso, R. (2024). Modeling SO2 dispersion from future eruptions in the Auckland Volcanic Field, New Zealand. Journal of Applied Volcanology, 13(1), 1-18.
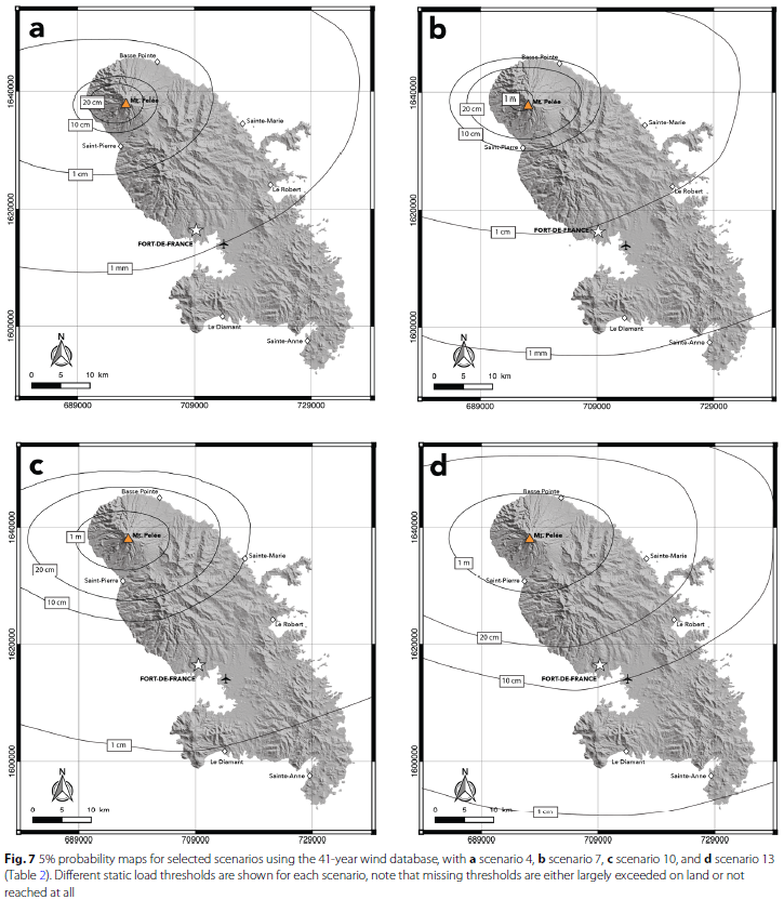
Figure in a journal article
5% probability maps for selected scenarios
Figure 7 in: Michaud-Dubuy, A., Carazzo, G., & Kaminski, E. (2021). Volcanic hazard assessment for tephra fallout in Martinique. Journal of Applied Volcanology, 10(1), 1-20. https://doi.org/10.1186/s13617-021-00106-7.
Official, Figure in hazard assessment
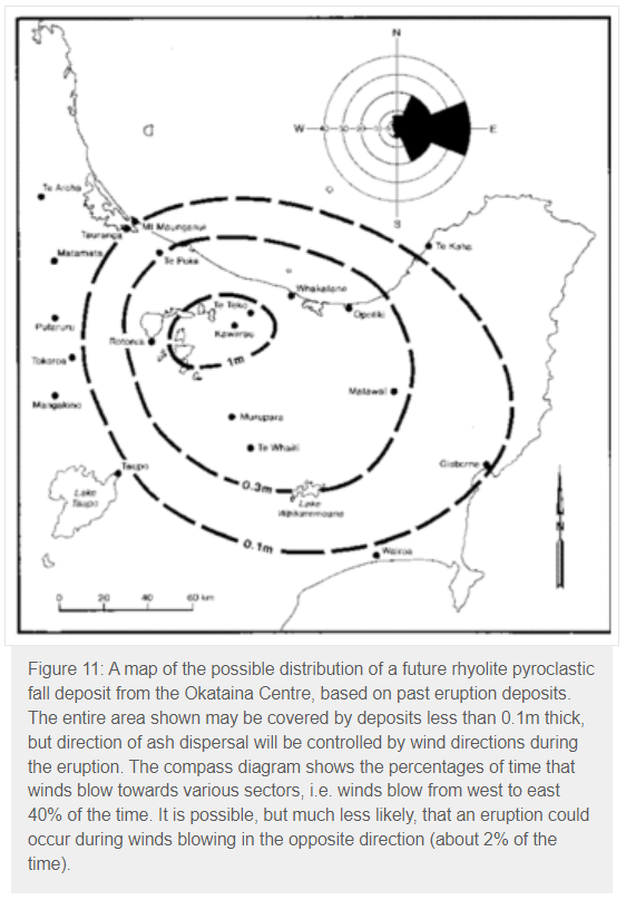
A map of the possible distribution of a future rhyolite pyroclastic fall deposit from the Okataina Centre, based on past eruption deposits
Figure 11 in: Nairn, I.A. (1993). Volcanic hazards at Okataina Centre. 3rd ed. Ministry of Civil Defence, Palmerston North, NZ. Volcanic hazards information series 2. 29 p. Reproduced on website: https://www.gns.cri.nz/Home/Learning/Science-Topics/Volcanoes/New-Zealand-Volcanoes/Volcano-Geology-and-Hazards/Okataina-Volcanic-Centre-Geology
Official, Figure in a journal article
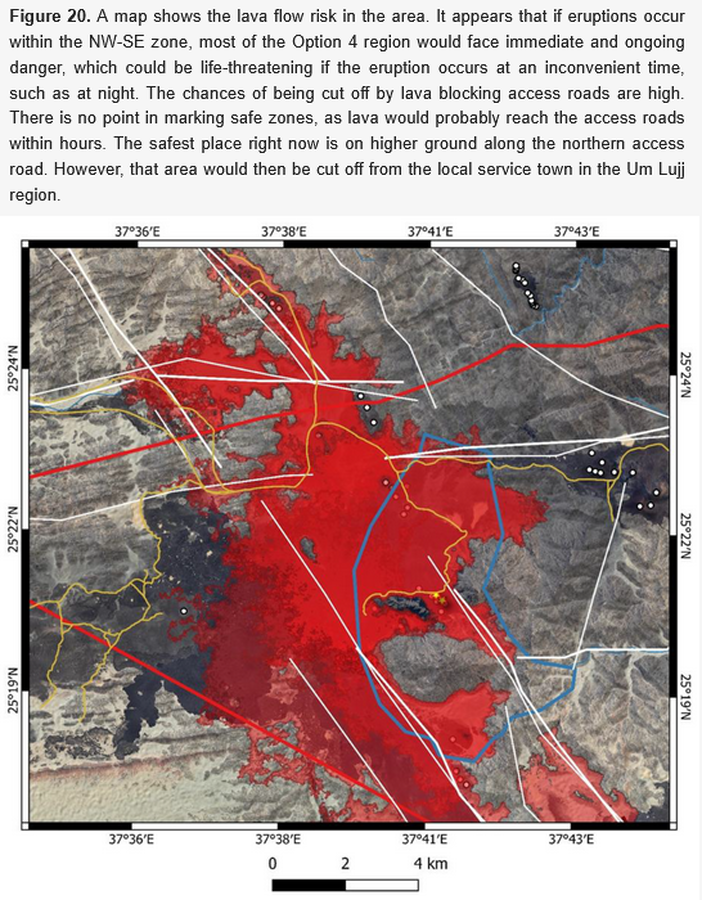
A map shows the lava flow risk in the area
Figure 20 in: Németh, K., Sowaigh, A., Ashor, M., Toni, M., & Sokolov, V. (2026). Volcanic Hazard Assessment of a Monogenetic Volcanic Field with Sporadic and Limited Information: Deterministic Approach for Harrat Lunayyir, Saudi Arabia. GeoHazards, 7(1), 33. https://doi.org/10.3390/geohazards7010033
Official, Figure in a journal article
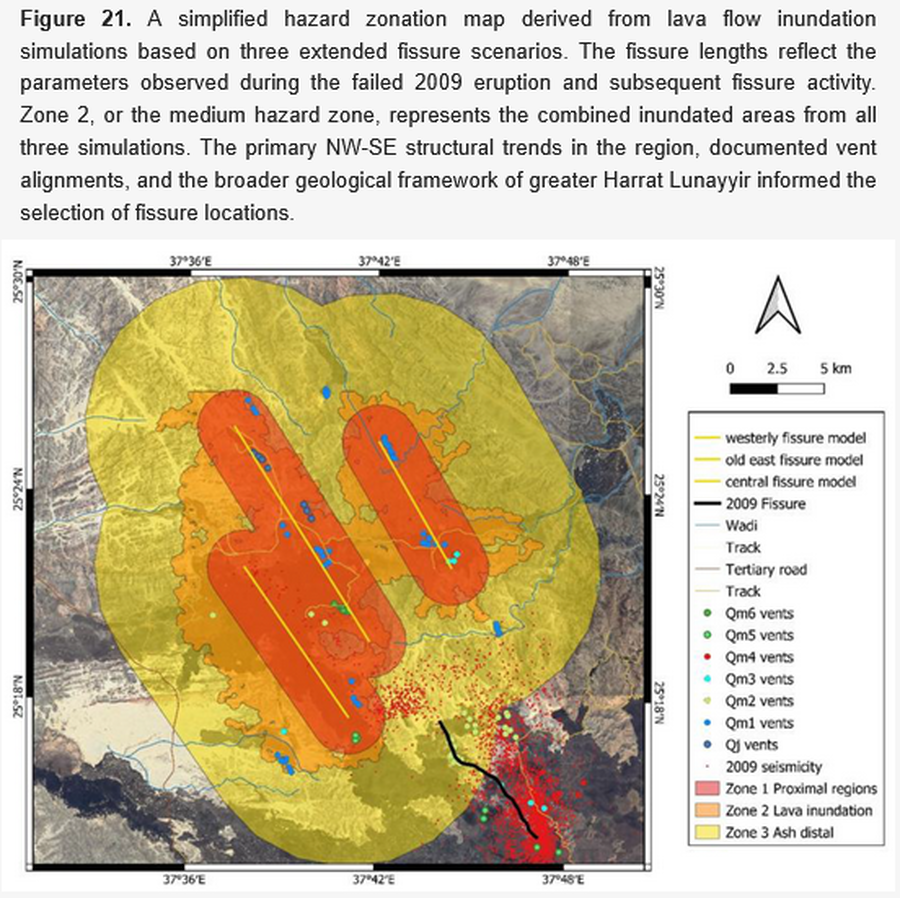
A simplified hazard zonation map derived from lava flow inundation simulations based on three extended fissure scenarios
Figure 21 in: Németh, K., Sowaigh, A., Ashor, M., Toni, M., & Sokolov, V. (2026). Volcanic Hazard Assessment of a Monogenetic Volcanic Field with Sporadic and Limited Information: Deterministic Approach for Harrat Lunayyir, Saudi Arabia. GeoHazards, 7(1), 33. https://doi.org/10.3390/geohazards7010033

Figure in a journal article
Absolute probability for areas to be affected by a ballistic impact density >0.001
Figure 12 in: Strehlow, K., Sandri, L., Gottsmann, J. H., Kilgour, G., Rust, A. C., & Tonini, R. (2017). Phreatic eruptions at crater lakes: occurrence statistics and probabilistic hazard forecast. Journal of Applied Volcanology, 6(1), 4. https://doi.org/10.1186/s13617-016-0053-2
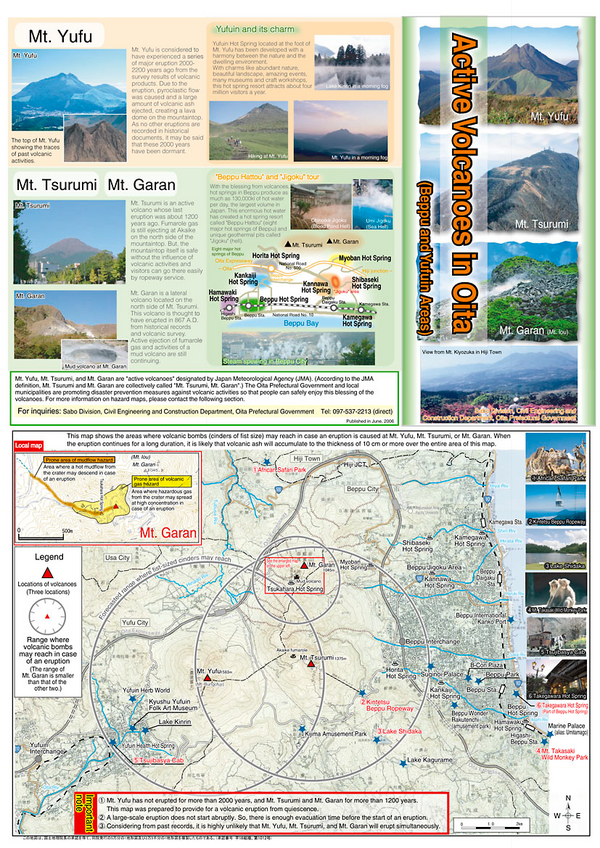
Official, Map sheet or poster
Active Volcanoes in Oita
Oita Prefectural Government. (2006). Active Volcanoes in Oita (Beppu and Yufuin Areas). Sabo Division, Civil Engineering and Construction Department, Oita Prefectural Government.