
Advanced Search for Maps
Showing 1-3 of 3
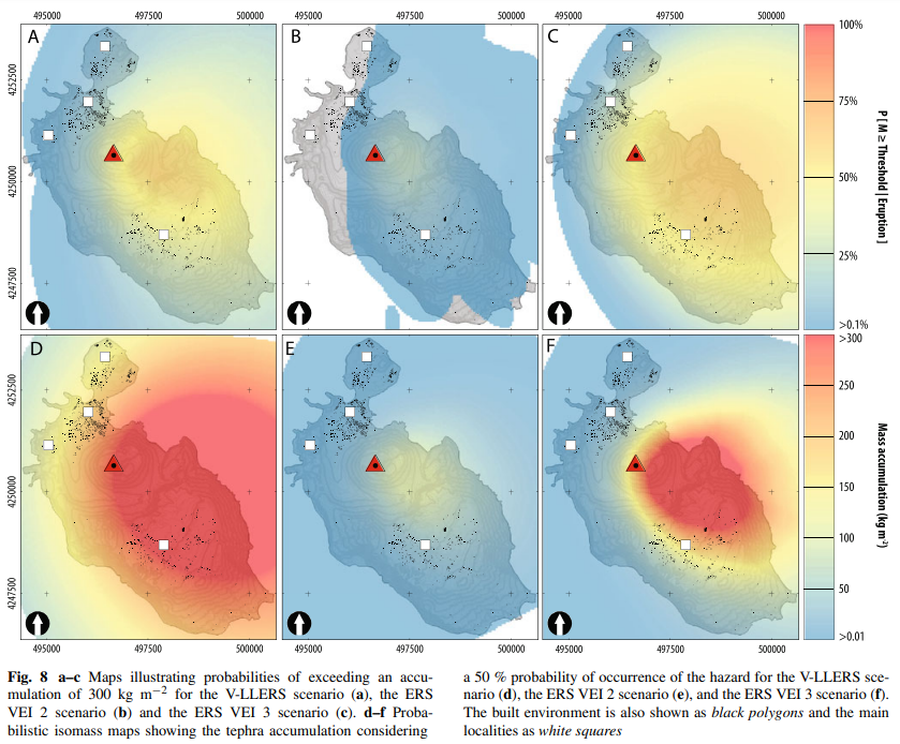
Figure in a journal article
Maps illustrating probabilities of exceeding an accumulation of 300 kg m−2 for the V-LLERS scenario. Probabilistic isomass maps showing the tephra accumulation considering a 50 % probability of occurrence of the hazard for the V-LLERS scenario.
Figure 8 in: Biass, S., Bonadonna, C., Di Traglia, F., Pistolesi, M., Rosi, M., & Lestuzzi, P. (2016). Probabilistic evaluation of the physical impact of future tephra fallout events for the Island of Vulcano, Italy. Bulletin of Volcanology, 78(5), 1-22. https://doi.org/10.1007/s00445-016-1028-1
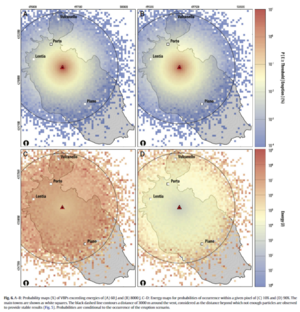
Figure in a journal article
Probability maps (%) of VBPs exceeding energies of (A) 60 J and (B) 8000 J. Energy maps for probabilities of occurrence within a given pixel of (C) 10% and (D) 90%.
Figure 6 in: Biass, S., Falcone, J. L., Bonadonna, C., Di Traglia, F., Pistolesi, M., Rosi, M., & Lestuzzi, P. (2016). Great Balls of Fire: A probabilistic approach to quantify the hazard related to ballistics—A case study at La Fossa volcano, Vulcano Island, Italy. Journal of Volcanology and Geothermal Research, 325, 1-14. https://doi.org/10.1016/j.jvolgeores.2016.06.006
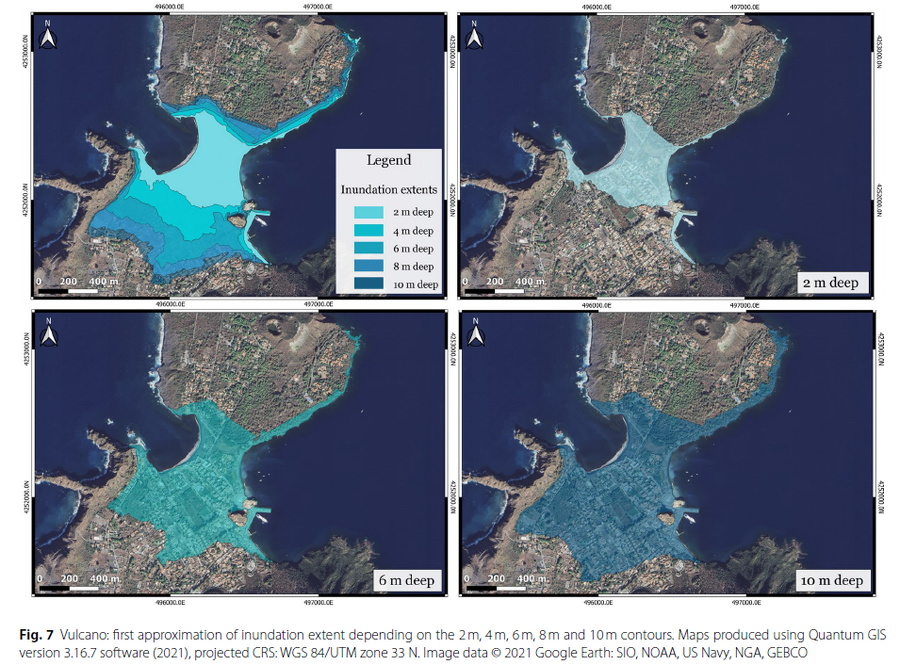
Figure in a journal article
Vulcano: first approximation of inundation extent depending on the 2 m, 4 m, 6 m, 8 m and 10 m contours.
Figure 7 in: Bonilauri, E. M., & Harris, A. J. (2026). Tsunami evacuation times and routes to safe zones II: a GIS-based approach applied to Vulcano and Lipari (Aeolian Islands, Italy) to assess escape route challenges for low-lying harbour areas. Journal of Applied Volcanology, 15(1), 5.