
Advanced Search for Maps
Showing 1-10 of 26
Official, Figure in hazard assessment
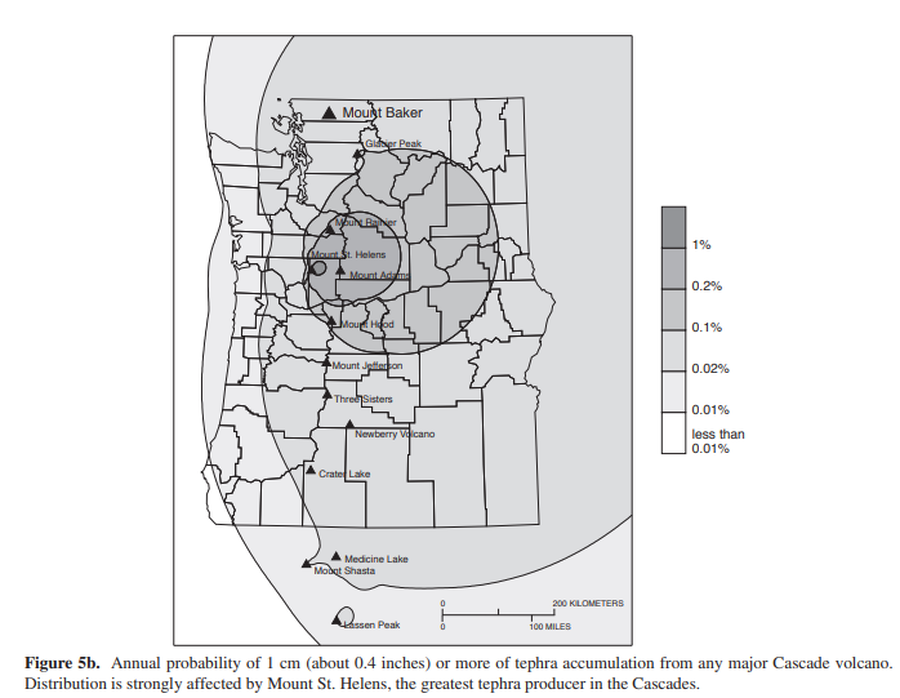
Annual probability of 1 cm (about 0.4 inches) or more of tephra accumulation from any major Cascade volcano
Figure 5b in: Gardner, C.A., Scott, K.M., Miller, C.D., Myers, B., Hildreth, W., & Pringle, P.T. (1995). Potential volcanic hazards from future activity of Mount Baker, Washington. U.S. Geological Survey, Open-File Report 95-498, 16 p., 1 plate, scale 1:100,000. https://doi.org/10.3133/ofr95498
Official, Figure in hazard assessment
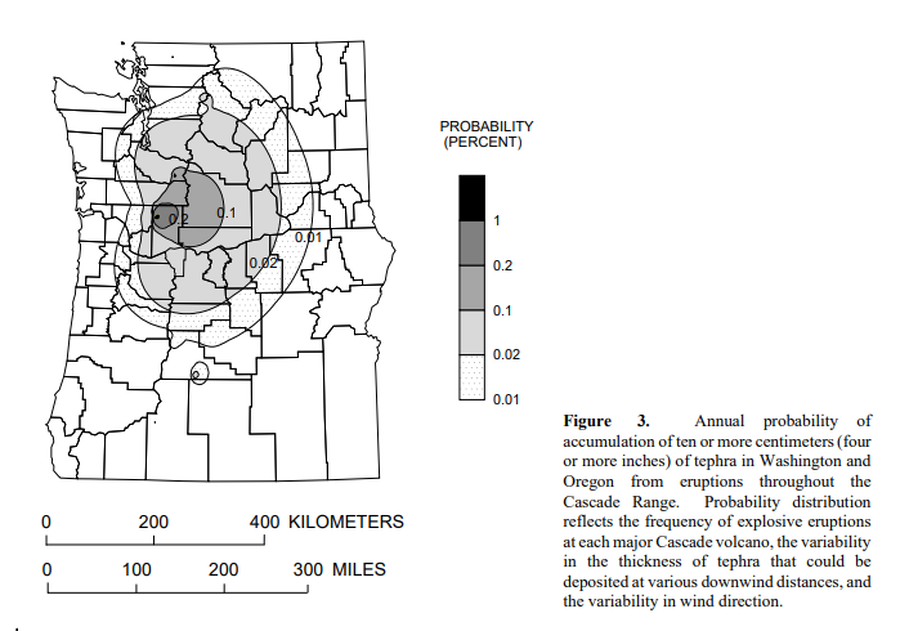
Annual probability of accumulation of ten or more centimeters (four or more inches) of tephra in Washington and Oregon from eruptions throughout the Cascade Range.
Figure 3 in: Wolfe, E.W. & Pierson, T.C. (1995). Volcanic-Hazard Zonation for Mount St. Helens, Washington, 1995. U.S. Geological Survey, Open-File Report 95-497, 12 p., 1 plate. https://doi.org/10.3133/ofr95497
Official, Insert/poster-size map with accompanying report
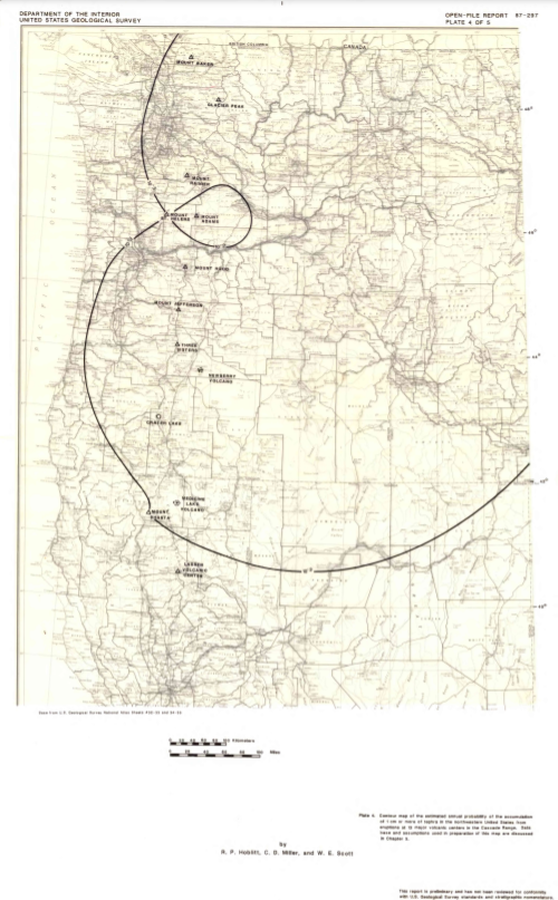
Contour map of the estimated annual probability of the accumulation of 1 cm or more of tephra in the northwestern United States at eruptions at 13 major volcanic centers in the Cascades Range
Plate 4 in: Hoblitt, R. P., Miller, C. D., & Scott, W. E. (1987). Volcanic hazards with regard to siting nuclear-power plants in the Pacific Northwest. U.S. Geological Survey, Open-File Report 87-297. https://doi.org/10.3133/ofr87297
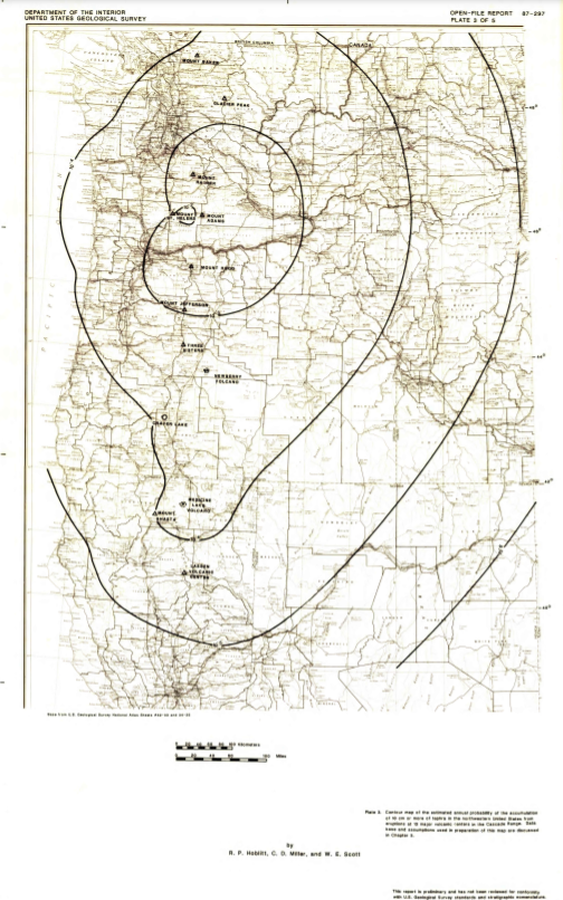
Official, Insert/poster-size map with accompanying report
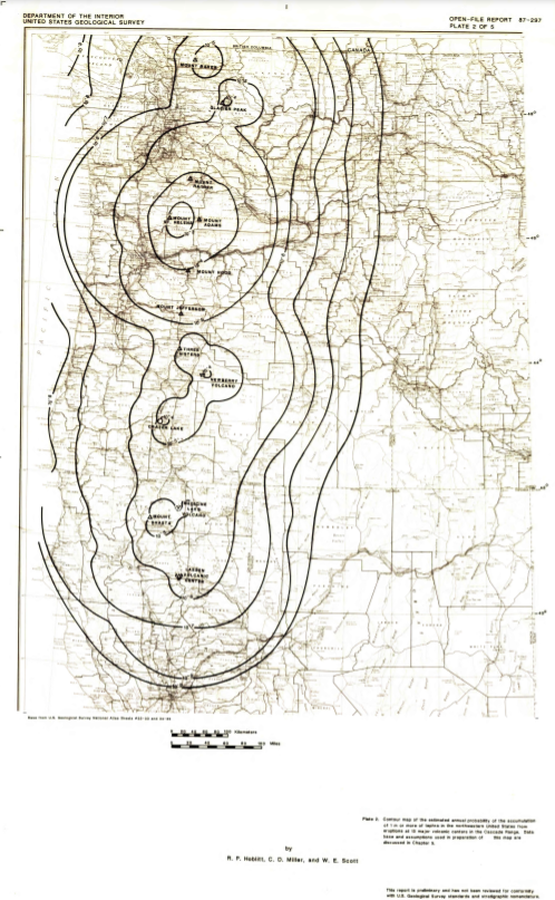
Contour map of the estimated annual probability of the accumulation of 1 m or more of tephra in the northwestern United States at eruptions at 13 major volcanic centers in the Cascades Range
Plate 2 in: Hoblitt, R. P., Miller, C. D., & Scott, W. E. (1987). Volcanic hazards with regard to siting nuclear-power plants in the Pacific Northwest. U.S. Geological Survey, Open-File Report 87-297. https://doi.org/10.3133/ofr87297
Official, Insert/poster-size map with accompanying report
Contour map of the estimated annual probability of the accumulation of 10 cm or more of tephra in the northwestern United States at eruptions at 13 major volcanic centers in the Cascades Range
Plate 3 in: Hoblitt, R. P., Miller, C. D., & Scott, W. E. (1987). Volcanic hazards with regard to siting nuclear-power plants in the Pacific Northwest. U.S. Geological Survey, Open-File Report 87-297. https://doi.org/10.3133/ofr87297
Official, Figure in hazard assessment
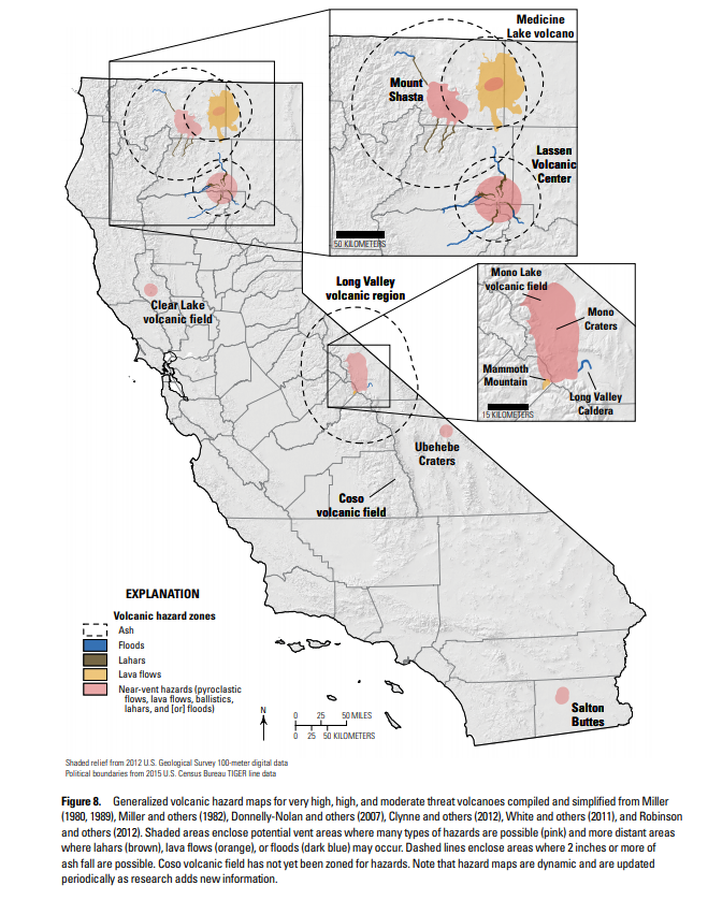
Generalized volcanic hazard maps for very high, high, and moderate threat volcanoes compiled and simplified from Miller (1980, 1989), Miller and others (1982), Donnelly-Nolan and others (2007), Clynne and others (2012), White and others (2011), and Robinson and others (2012)
Figure 8 in: Mangan, M., Ball, J., Wood, N., Jones, J.L., Peters, J., Abdollahian, N., Dinitz, L., Blankenheim, S., Fenton, J., & Pridmore, C. (2019). California’s exposure to volcanic hazards. U.S. Geological Survey Scientific Investigations Report 2018–5159, v. 1.1, 49 p. https://doi.org/10.3133/sir20185159
Official, Figure in hazard assessment
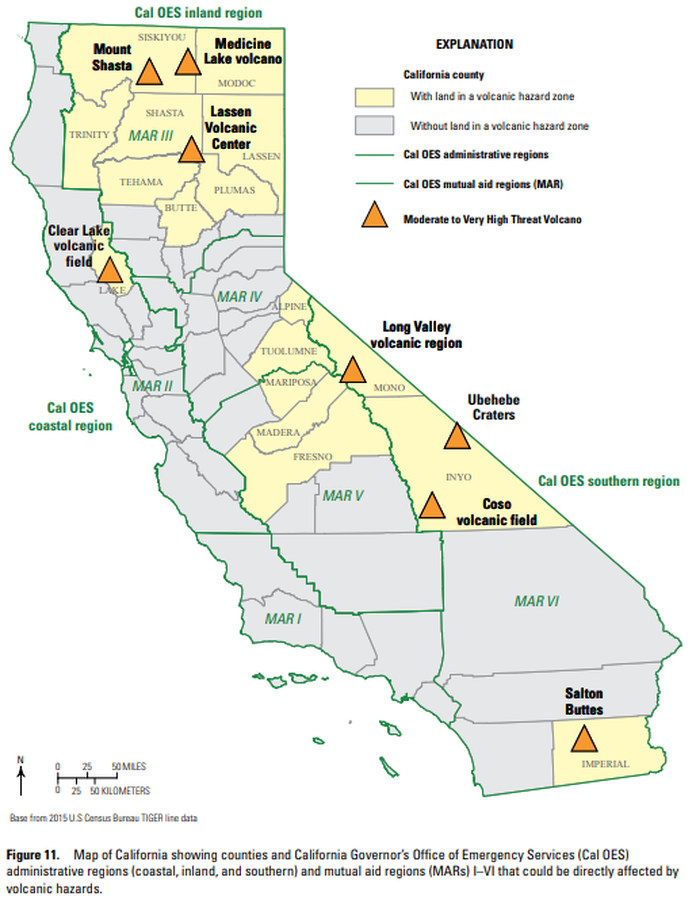
Map of California showing counties and California Governor’s Office of Emergency Services (Cal OES) administrative regions (coastal, inland, and southern) and mutual aid regions (MARs) I–VI that could be directly affected by volcanic hazards.
Figure 11 in: Mangan, M., Ball, J., Wood, N., Jones, J.L., Peters, J., Abdollahian, N., Dinitz, L., Blankenheim, S., Fenton, J., & Pridmore, C. (2019). California’s exposure to volcanic hazards. U.S. Geological Survey Scientific Investigations Report 2018–5159, v. 1.1, 49 p. https://doi.org/10.3133/sir20185159
Official, Figure in hazard assessment
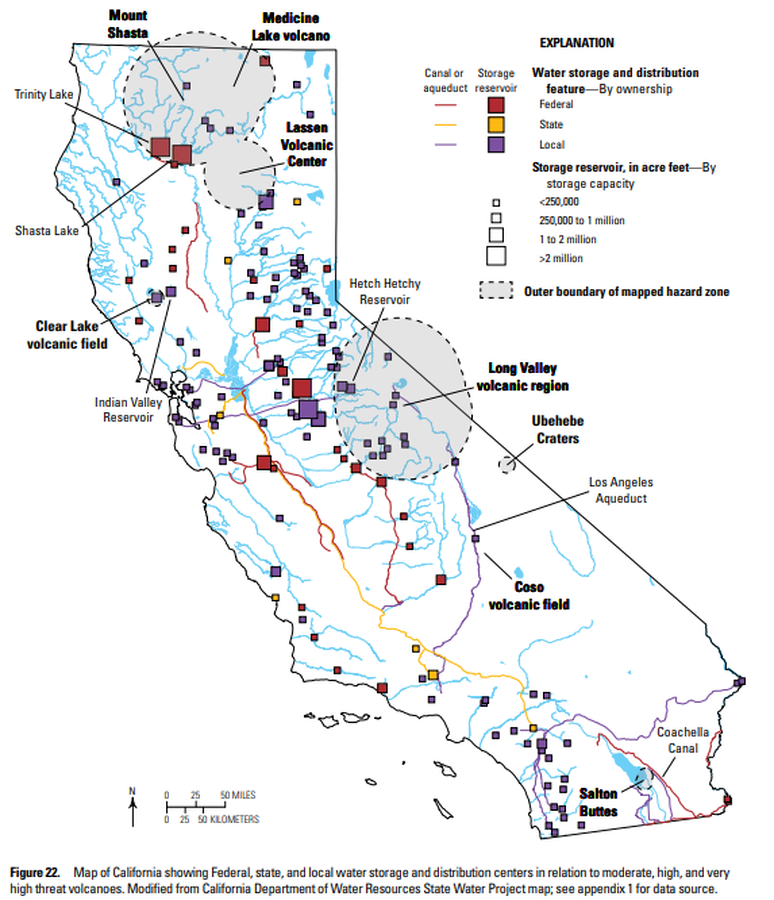
Map of California showing Federal, state, and local water storage and distribution centers in relation to moderate, high, and very high threat volcanoes
Figure 22 in: Mangan, M., Ball, J., Wood, N., Jones, J.L., Peters, J., Abdollahian, N., Dinitz, L., Blankenheim, S., Fenton, J., & Pridmore, C. (2019). California’s exposure to volcanic hazards. U.S. Geological Survey Scientific Investigations Report 2018–5159, v. 1.1, 49 p. https://doi.org/10.3133/sir20185159
Official, Figure in hazard assessment
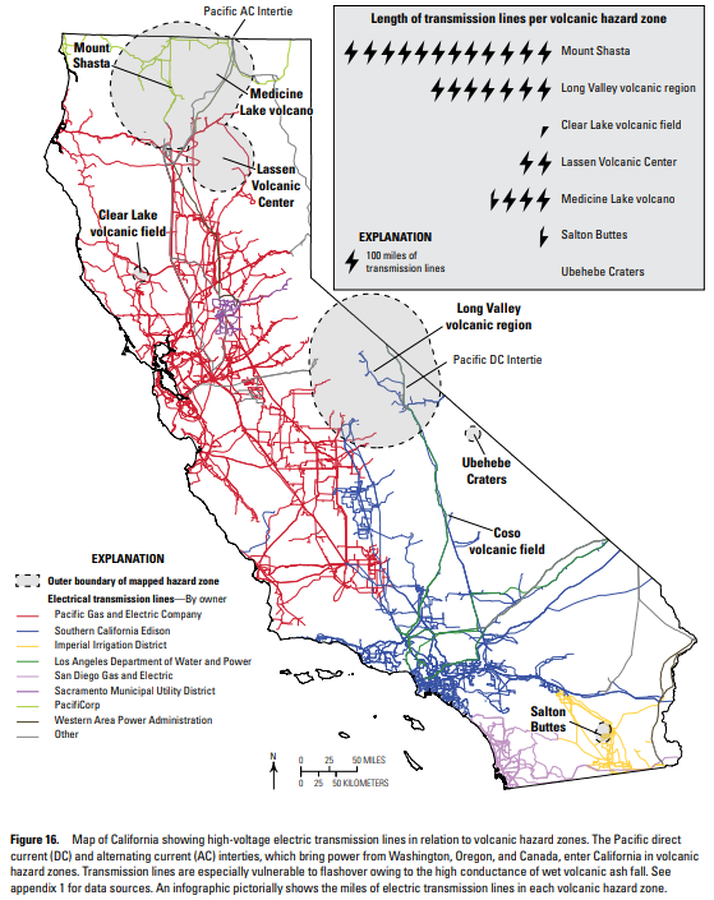
Map of California showing high-voltage electric transmission lines in relation to volcanic hazard zones
Figure 16 in: Mangan, M., Ball, J., Wood, N., Jones, J.L., Peters, J., Abdollahian, N., Dinitz, L., Blankenheim, S., Fenton, J., & Pridmore, C. (2019). California’s exposure to volcanic hazards. U.S. Geological Survey Scientific Investigations Report 2018–5159, v. 1.1, 49 p. https://doi.org/10.3133/sir20185159
Official, Figure in hazard assessment
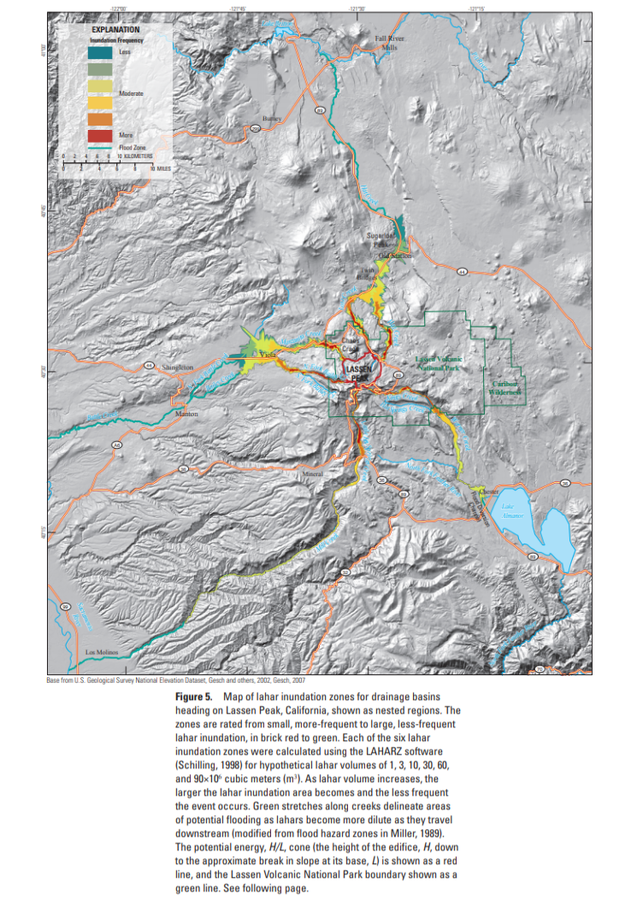
Map of lahar inundation zones for drainage basins
Figure 5 in: Robinson, J. E. & Clynne, M. A. (2012). Lahar Hazard Zones for Eruption-Generated Lahars in the Lassen Volcanic Center, California. U.S. Geological Survey Scientific Investigations Report , 2012-5176-C, 13 p. https://doi.org/10.3133/sir20125176C