
Advanced Search for Maps
Showing 1-10 of 21

Figure in a journal article
Absolute probability for areas to be affected by a ballistic impact density >0.001
Figure 12 in: Strehlow, K., Sandri, L., Gottsmann, J. H., Kilgour, G., Rust, A. C., & Tonini, R. (2017). Phreatic eruptions at crater lakes: occurrence statistics and probabilistic hazard forecast. Journal of Applied Volcanology, 6(1), 4. https://doi.org/10.1186/s13617-016-0053-2
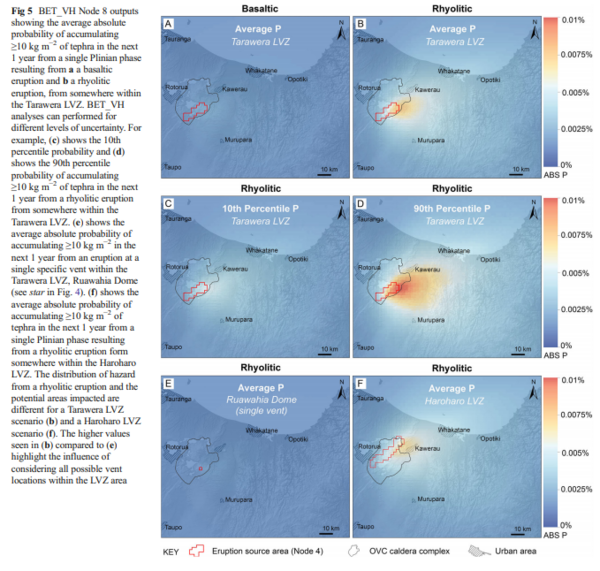
Figure in a journal article
BET_VH Node 8 outputs showing the average absolute probability of accumulating ≥10 kg m−2 of tephra in the next 1 year from a single Plinian phase resulting from a a basaltic eruption and b a rhyolitic eruption, from somewhere within the Tarawera LVZ
Figure 5 in: Thompson, M. A., Lindsay, J. M., Sandri, L., Biass, S., Bonadonna, C., Jolly, G., & Marzocchi, W. (2015). Exploring the influence of vent location and eruption style on tephra fall hazard from the Okataina Volcanic Centre, New Zealand. Bulletin of volcanology, 77(5), 38. https://doi.org/10.1007/s00445-015-0926-y
Official, Figure in a journal article
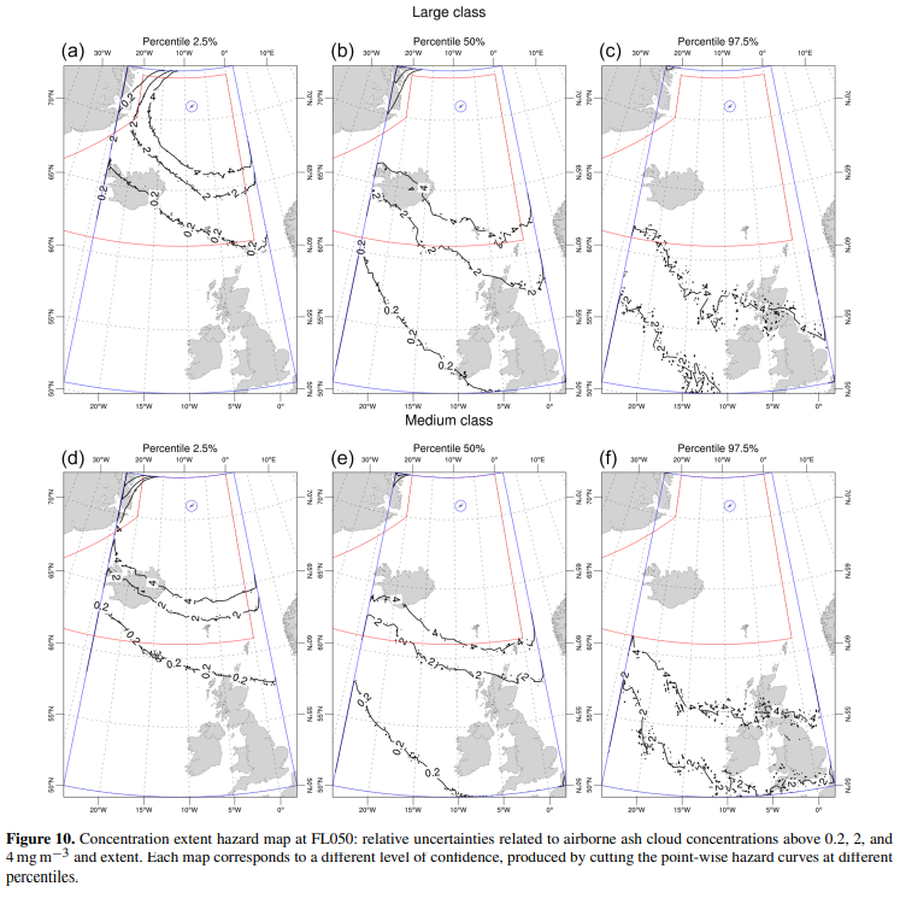
Concentration extent hazard map at FL050
Figure 10 in: Titos, M., Martínez Montesinos, B., Barsotti, S., Sandri, L., Folch, A., Mingari, L., Macedonio, G. & Costa, A. (2022). Long-term hazard assessment of explosive eruptions at Jan Mayen (Norway) and implications for air traffic in the North Atlantic. Natural Hazards and Earth System Sciences, 22(1), 139-163. https://doi.org/10.5194/nhess-22-139-2022
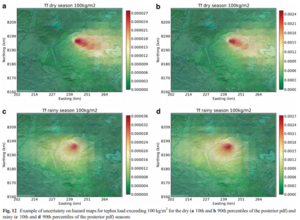
Figure in a journal article
Example of uncertainty on hazard maps for tephra load exceeding 100 kg/m² for the dry (10th and 90th percentiles of the posterior pdf) and rainy (10th and 90th percentiles of the posterior pdf) seasons
Figure 12 in: Sandri, L., Thouret, J. C., Constantinescu, R., Biass, S., & Tonini, R. (2014). Long-term multi-hazard assessment for El Misti volcano (Peru). Bulletin of volcanology, 76(2), 771. https://doi.org/10.1007/s00445-013-0771-9
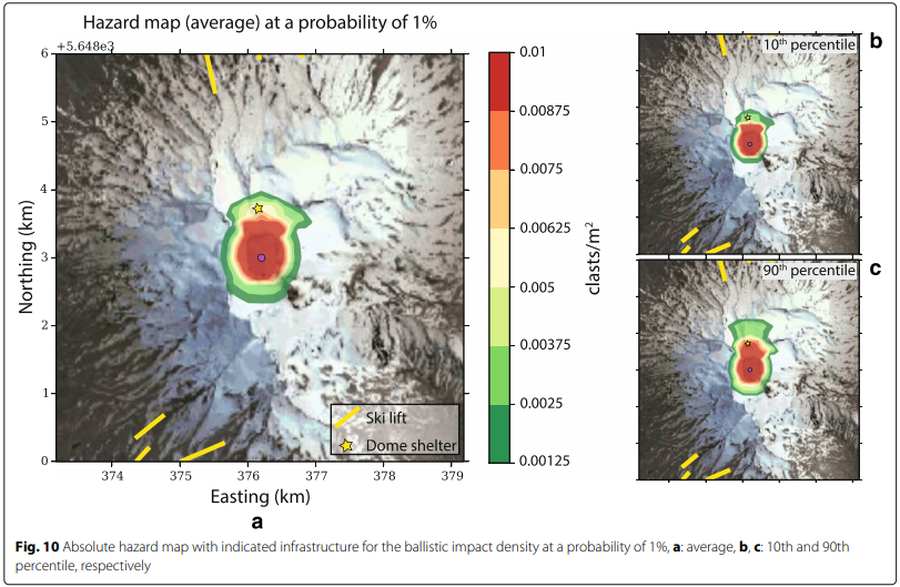
Figure in a journal article
Hazard map (average) at a probability of 1%
Figure 10 in: Strehlow, K., Sandri, L., Gottsmann, J. H., Kilgour, G., Rust, A. C., & Tonini, R. (2017). Phreatic eruptions at crater lakes: occurrence statistics and probabilistic hazard forecast. Journal of Applied Volcanology, 6(1), 4. https://doi.org/10.1186/s13617-016-0053-2
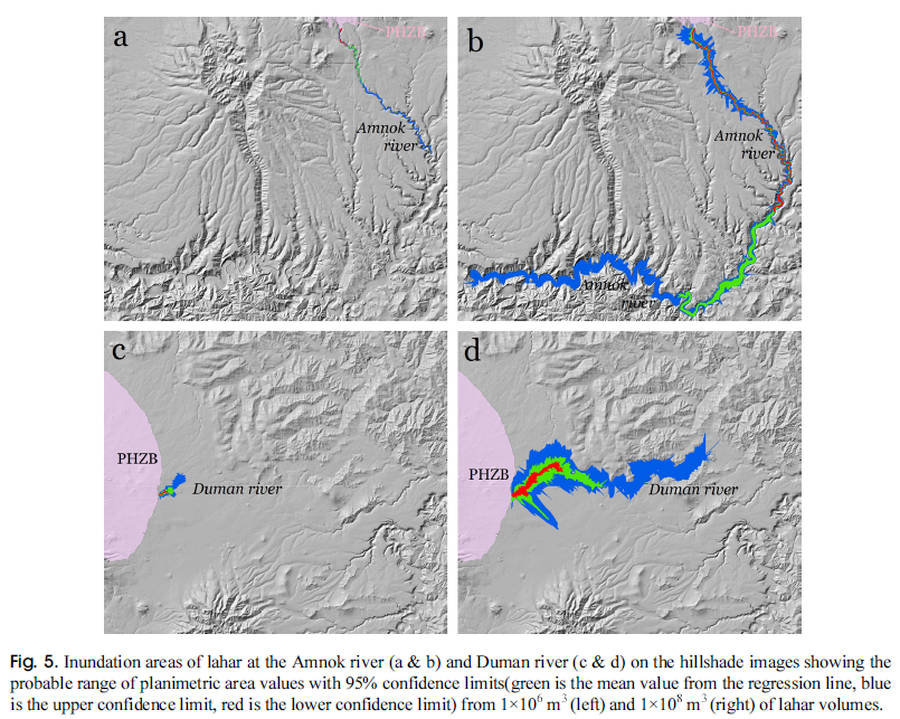
Figure in a journal article
Inundation areas of lahar at the Amnok river and Duman river
Figure 5 in: Yun, S. H. & Chang, C. (2017). Prediction of Lahar Flow Inundation Areas Using LAHARZ_py Program: Application for the Mt. Baekdu Volcano. Economic and Environmental Geology, 50(4), 277-286. https://doi.org/10.9719/EEG.2017.50.4.277
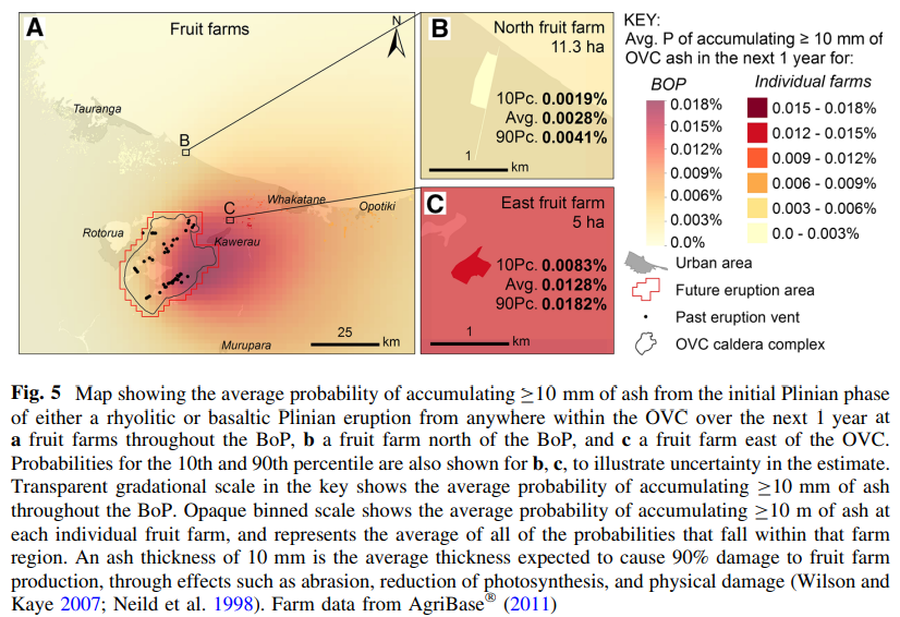
Figure in a journal article
Map showing the average probability of accumulating C10 mm of ash from the initial Plinian phase of either a rhyolitic or basaltic Plinian eruption from anywhere within the OVC over the next 1 year
Figure 5 in: Thompson, M. A., Lindsay, J. M., Wilson, T. M., Biass, S., & Sandri, L. (2017). Quantifying risk to agriculture from volcanic ashfall: a case study from the Bay of Plenty, New Zealand. Natural Hazards, 86(1), 31-56. https://doi.org/10.1007/s11069-016-2672-7
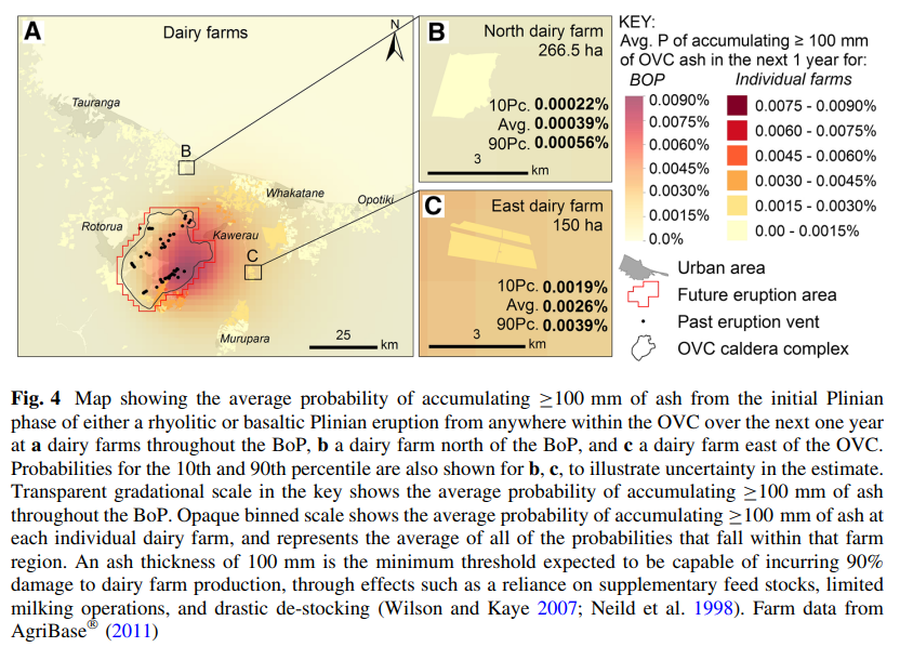
Figure in a journal article
Map showing the average probability of accumulating ≥100 mm of ash from the initial Plinian phase of either a rhyolitic or basaltic Plinian eruption from anywhere within the OVC over the next one year
Figure 4 in: Thompson, M. A., Lindsay, J. M., Wilson, T. M., Biass, S., & Sandri, L. (2017). Quantifying risk to agriculture from volcanic ashfall: a case study from the Bay of Plenty, New Zealand. Natural Hazards, 86(1), 31-56. https://doi.org/10.1007/s11069-016-2672-7
Official, Figure in hazard assessment
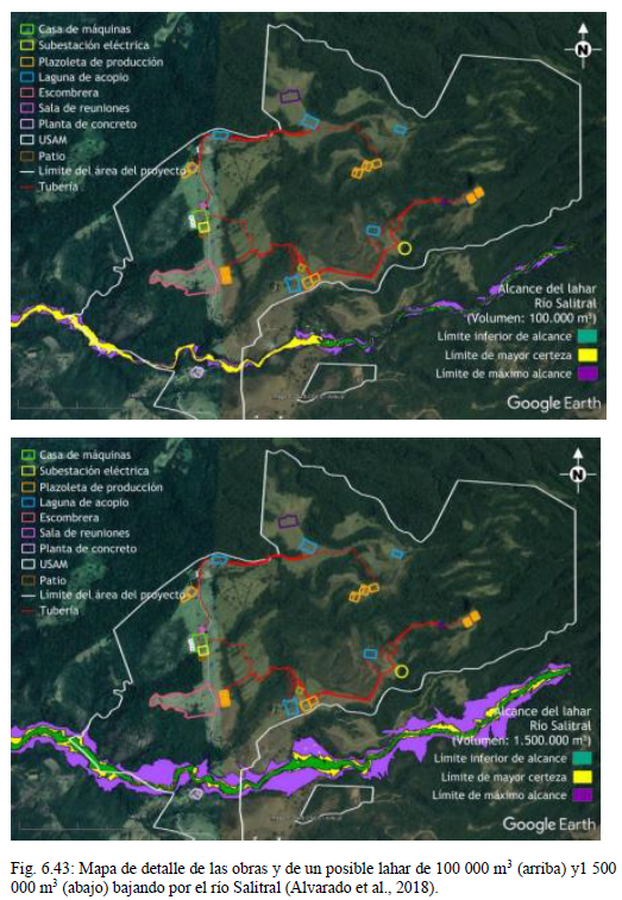
Mapa de detalle de las obras y de un posible lahar de 100 000 m3 (arriba) y 1 500 000 m3 (abajo) bajando por el río Salitral
(Detail map of the works and a possible lahar of 100,000 m3 (above) and 1,500,000 m3 (below) going down the Salitral River)
Figure 6.43 (in reprint) in: Alvarado, G.E., Aguilar, I.L. & Vargas, A. (2018). Evaluación de la amenaza volcánica del Rincón de la Vieja para el proyecto geotérmico Borinquen, Guanacaste. Área de Amenazas y Auscultación Sismológica y Volcánica, ICE [Inf. Interno]. Reprinted in: Alvarado, G.E., Brenes-André, J., Venegas, L., Alpízar, Y., Núñez, S., Sánchez, M., Abarca, K., Abarca, J., Báez, W.A., Sibaja, J.P., Esquivel, L., & Arcia, T. (2022). Análisis del Peligro Volcánico del Rincón de la Vieja, Costa Rica. Instituto Costarricense de Electricidad (ICE). Setiembre 2022.
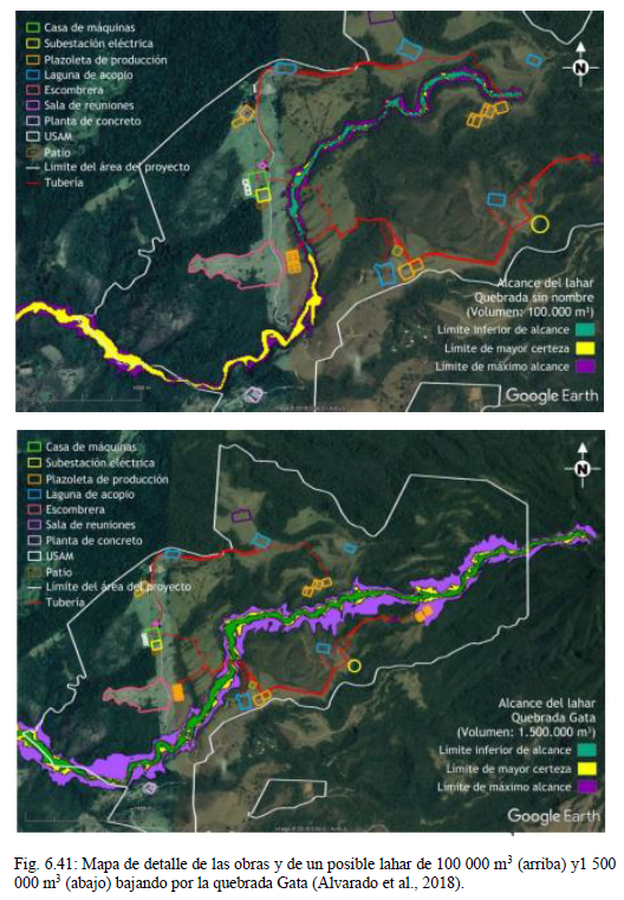
Official, Figure in hazard assessment
Mapa de detalle de las obras y de un posible lahar de 100 000 m3 (arriba) y 1 500 000 m3 (abajo) bajando por la quebrada Gata
(Detail map of the works and a possible lahar of 100,000 m3 (above) and 1,500,000 m3 (below) going down the Gata ravine)
Figure 6.41 (in reprint) in: Alvarado, G.E., Aguilar, I.L. & Vargas, A. (2018). Evaluación de la amenaza volcánica del Rincón de la Vieja para el proyecto geotérmico Borinquen, Guanacaste. Área de Amenazas y Auscultación Sismológica y Volcánica, ICE [Inf. Interno]. Reprinted in: Alvarado, G.E., Brenes-André, J., Venegas, L., Alpízar, Y., Núñez, S., Sánchez, M., Abarca, K., Abarca, J., Báez, W.A., Sibaja, J.P., Esquivel, L., & Arcia, T. (2022). Análisis del Peligro Volcánico del Rincón de la Vieja, Costa Rica. Instituto Costarricense de Electricidad (ICE). Setiembre 2022.