
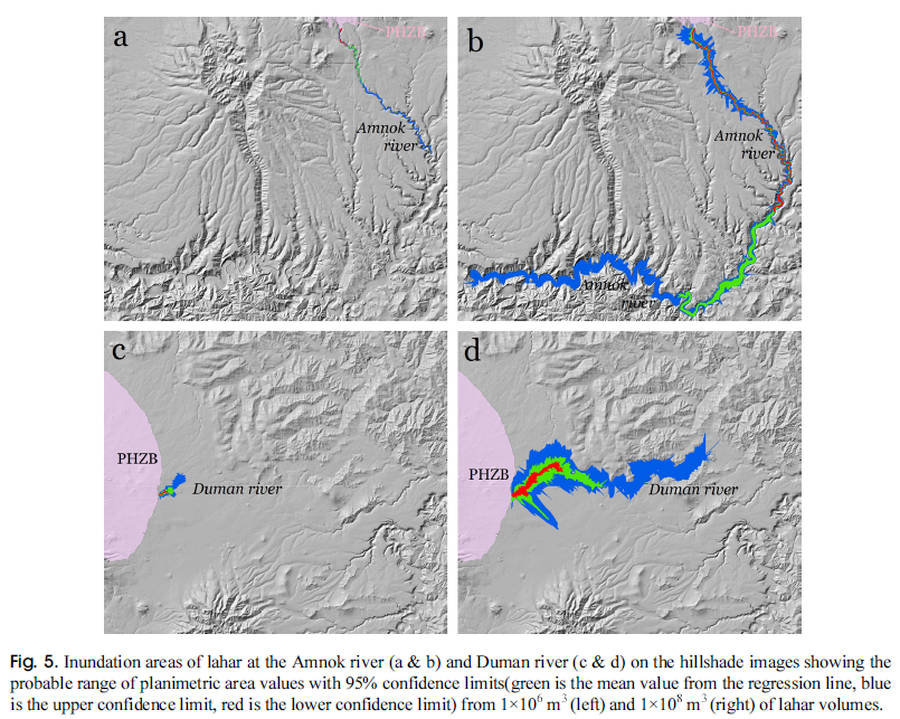
Inundation areas of lahar at the Amnok river and Duman river
Baekdusan (Changbaishan), China-North Korea, 2017
Figure 5 in: Yun, S. H. & Chang, C. (2017). Prediction of Lahar Flow Inundation Areas Using LAHARZ_py Program: Application for the Mt. Baekdu Volcano. Economic and Environmental Geology, 50(4), 277-286. https://doi.org/10.9719/EEG.2017.50.4.277
This hazard map is the result of scientific research and was published in academic literature.
It is presented here to serve as an example of the map type or the map-making methodology. It is NOT the official, operational map. For the current operational hazard map, please consult the proper institutional authorities.
Click on image for full-size map. If link seems broken, try the archived version.
Yun, S. H., & Chang, C. (2017). Prediction of Lahar Flow Inundation Areas Using LAHARZ_py Program: Application for the Mt. Baekdu Volcano. Economic and Environmental Geology, 50(4), 277-286. https://doi.org/10.9719/EEG.2017.50.4.277Map Set
https://doi.org/10.9719/EEG.2017.50.4.277
Other Maps In Set: