
Advanced Search for Maps
Showing 11-20 of 252
Official, Figure in hazard assessment
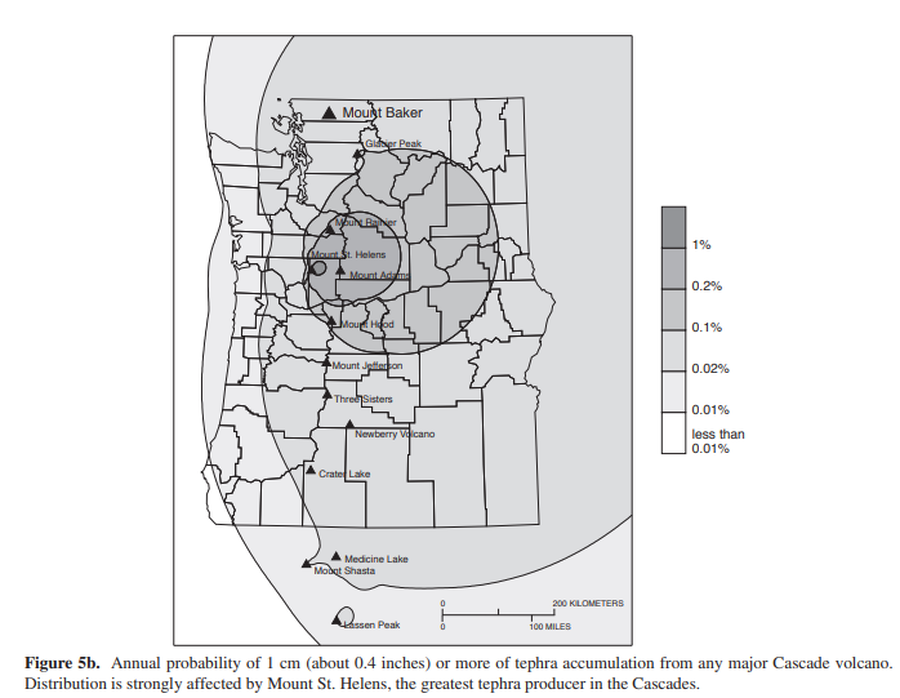
Annual probability of 1 cm (about 0.4 inches) or more of tephra accumulation from any major Cascade volcano
Figure 5b in: Gardner, C.A., Scott, K.M., Miller, C.D., Myers, B., Hildreth, W., & Pringle, P.T. (1995). Potential volcanic hazards from future activity of Mount Baker, Washington. U.S. Geological Survey, Open-File Report 95-498, 16 p., 1 plate, scale 1:100,000. https://doi.org/10.3133/ofr95498
Official, Figure in hazard assessment
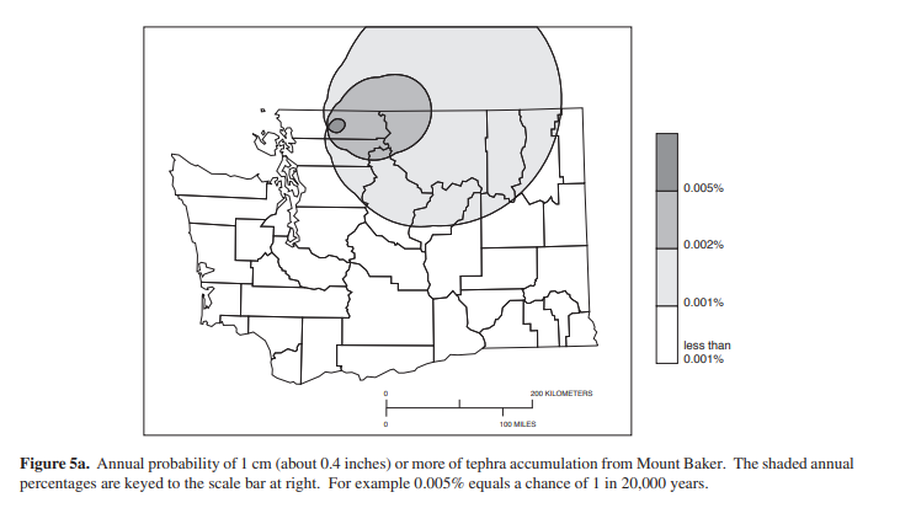
Annual probability of 1 cm (about 0.4 inches) or more of tephra from Mount Baker.
Figure 5a in: Gardner, C.A., Scott, K.M., Miller, C.D., Myers, B., Hildreth, W., & Pringle, P.T. (1995). Potential volcanic hazards from future activity of Mount Baker, Washington. U.S. Geological Survey, Open-File Report 95-498, 16 p., 1 plate, scale 1:100,000. https://doi.org/10.3133/ofr95498
Official, Figure in hazard assessment
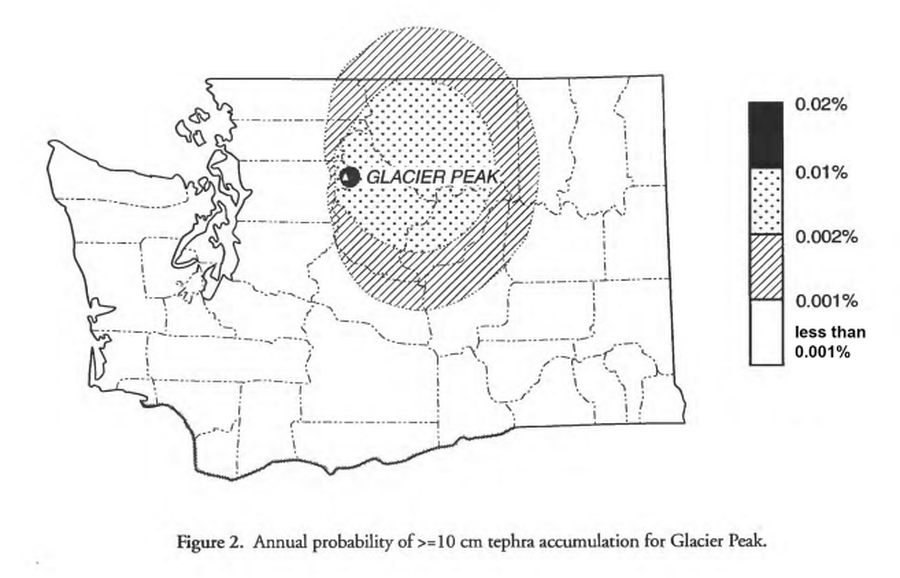
Annual probability of >=10 cm tephra accumulation for Glacier Peak
Figure 2 in: Waitt, R.B., Mastin, L.G., & Begét, J.E. (1995). Volcanic-Hazard Zonation for Glacier Peak Volcano, Washington. U.S. Geological Survey, Open-File Report 95-499, 9 p., 1 plate. https://doi.org/10.3133/ofr95499
Official, Figure in hazard assessment
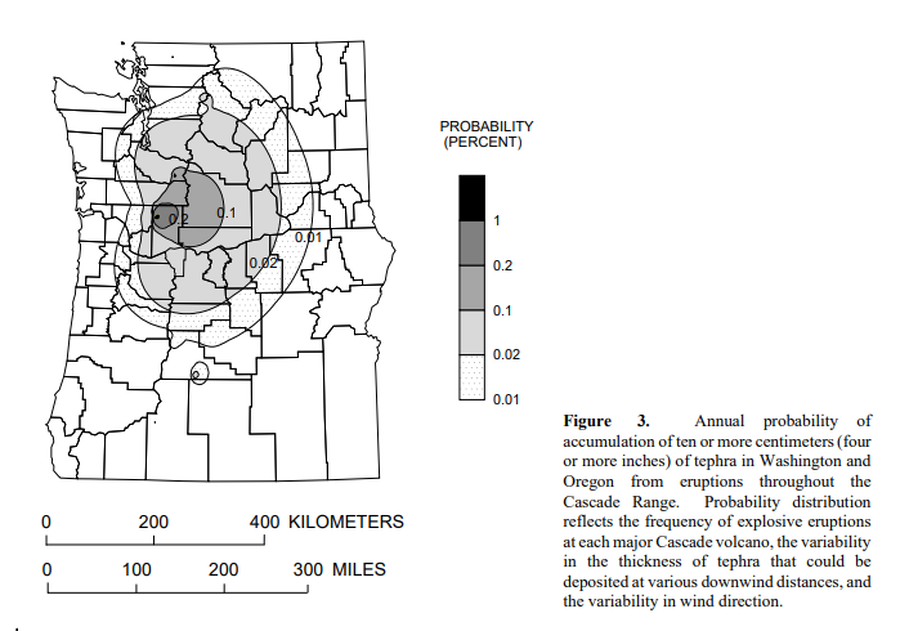
Annual probability of accumulation of ten or more centimeters (four or more inches) of tephra in Washington and Oregon from eruptions throughout the Cascade Range.
Figure 3 in: Wolfe, E.W. & Pierson, T.C. (1995). Volcanic-Hazard Zonation for Mount St. Helens, Washington, 1995. U.S. Geological Survey, Open-File Report 95-497, 12 p., 1 plate. https://doi.org/10.3133/ofr95497
Official, Figure in hazard assessment
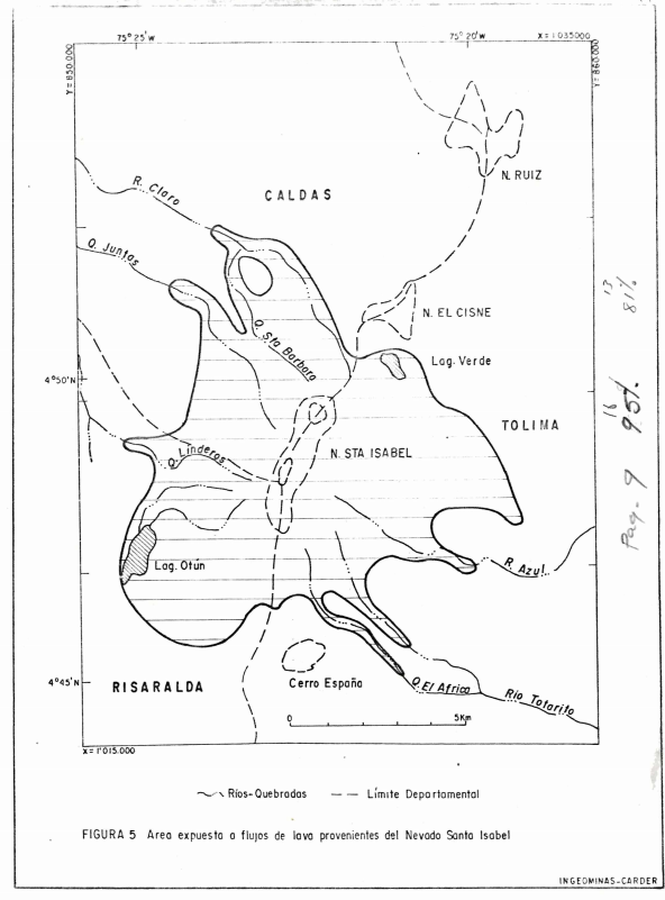
Area expuesta a flujos de lava provenientes del Nevado Santa Isabel
(Area exposed to lava flows from Nevado de Santa Isabel)
Figure 5 in: Instituto de Investigaciones en Geociencias, Mineria y Quimica (INGEOMINAS). (1993). Mapa Preliminar de Amenaza Volcanica Potencial Complejo de Domos Santa Isabel, Cordillera Central de Colombia. Ibague.
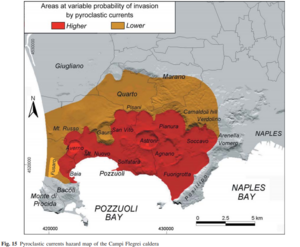
Figure in a journal article
Areas at variable probability of invasion by pyroclastic currents
Figure 15 in: Orsi, G., Di Vito, M. A., & Isaia, R. (2004). Volcanic hazard assessment at the restless Campi Flegrei caldera. Bulletin of Volcanology, 66(6), p. 514-530. https://doi.org/10.1007/s00445-003-0336-4
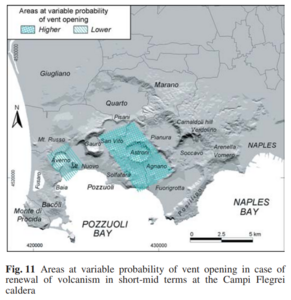
Figure in a journal article
Areas at variable probability of vent opening
Figure 11 in: Orsi, G., Di Vito, M. A., & Isaia, R. (2004). Volcanic hazard assessment at the restless Campi Flegrei caldera. Bulletin of Volcanology, 66(6), p. 514-530. https://doi.org/10.1007/s00445-003-0336-4
Official, Figure in hazard assessment
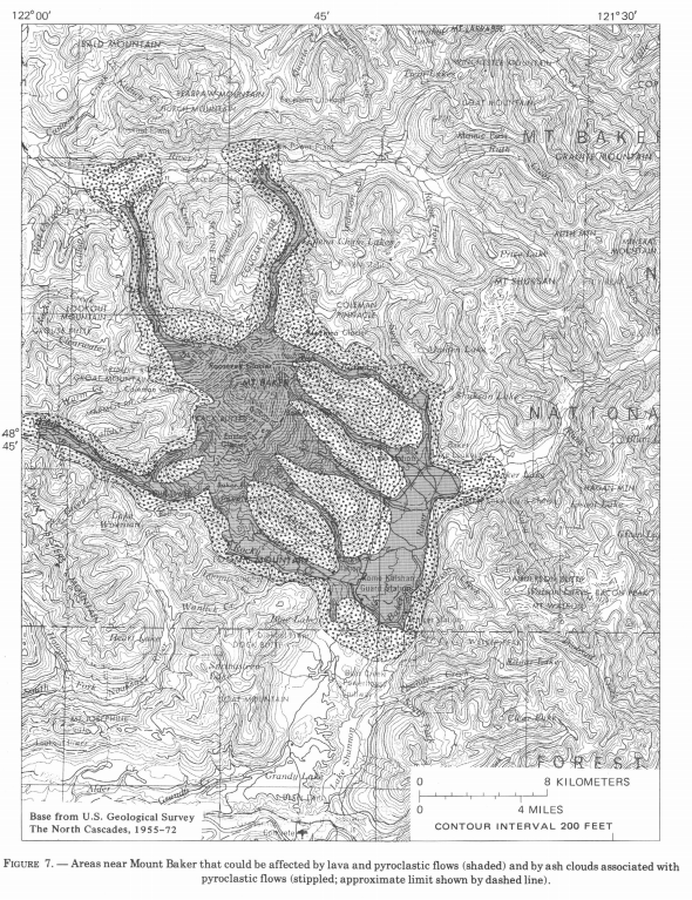
Areas near Mount Baker that could be affected by lava and pyroclastic flows (shaded) and by ash clouds associated with pyroclastic flows (stippled; approximate limit shown by dashed line)
Figure 7 in: Hyde, J. & Crandell, D.R. (1978). Postglacial volcanic deposits at Mount Baker, Washington, and potential hazards from future eruptions. U.S. Geological Survey, Professional Paper 1022-C, C1-C17, 1 plate in pocket. https://doi.org/10.3133/pp1022C
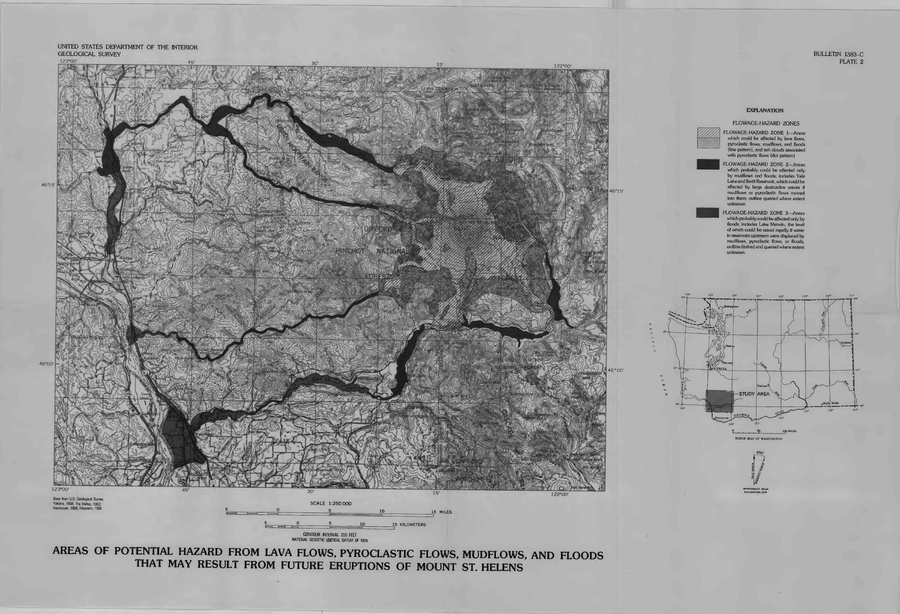
Official, Insert/poster-size map with accompanying report
Areas of Potential Hazard from Lava Flows, Pyroclastic Flows, Mudflows, and Floods that May Result from Future Eruptions of Mount St. Helens
Plate 2 in: Crandell, D.R. & Mullineaux, D.R. (1978). Potential Hazards from Future Eruptions of Mount St. Helens Volcano, Washington. U.S. Geological Survey, Bulletin 1383-C, 26 p. https://doi.org/10.3133/b1383C
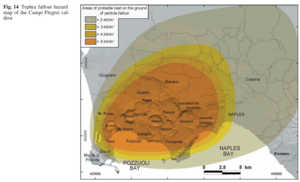
Figure in a journal article
Areas of probable load on the ground of particle fallout
Figure 14 in: Orsi, G., Di Vito, M. A., & Isaia, R. (2004). Volcanic hazard assessment at the restless Campi Flegrei caldera. Bulletin of Volcanology, 66(6), p. 514-530. https://doi.org/10.1007/s00445-003-0336-4