Advanced Search for Maps
Showing 11-19 of 19

Figure in a journal article
Map of the probability of lava flow inundation of the Mount Etna area by new eruptions from vents opened at elevations above 3000 m (calculated using a uniform probability of vent opening)
Figure 6 in: Favalli, M., Mazzarini, F., Pareschi, M. T., & Boschi, E. (2009). Topographic control on lava flow paths at Mount Etna, Italy: implications for hazard assessment. Journal of Geophysical Research: Earth Surface, 114(F1). https://doi.org/10.1029/2007JF000918
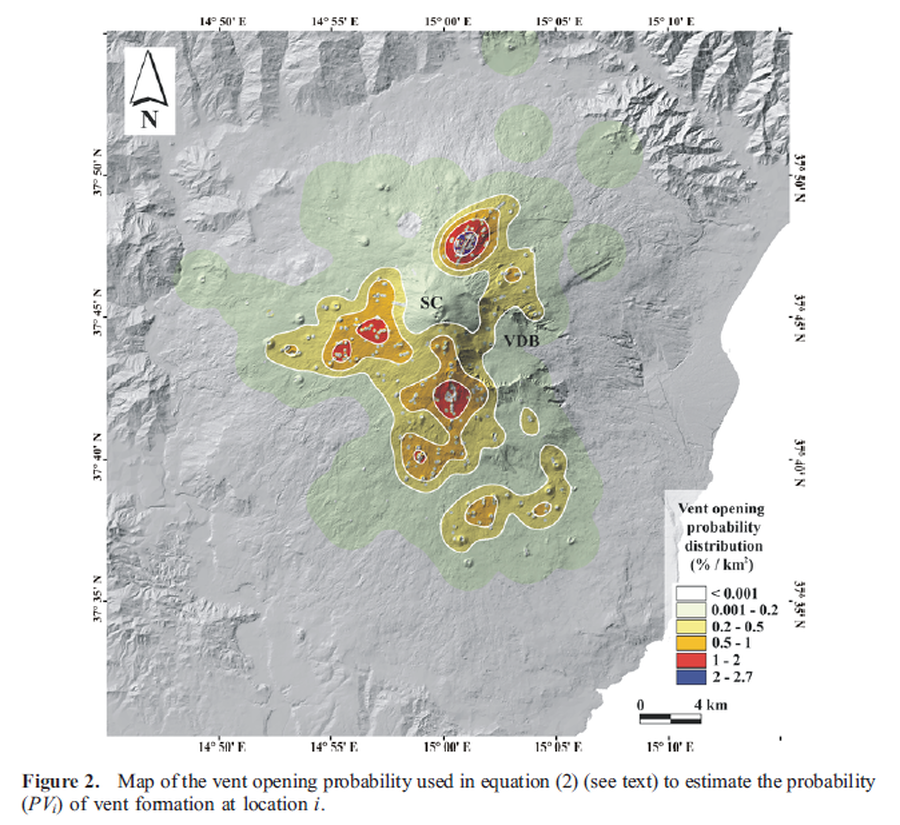
Figure in a journal article
Map of the vent opening probability
Figure 2 in: Favalli, M., Mazzarini, F., Pareschi, M. T., & Boschi, E. (2009). Topographic control on lava flow paths at Mount Etna, Italy: implications for hazard assessment. Journal of Geophysical Research: Earth Surface, 114(F1). https://doi.org/10.1029/2007JF000918
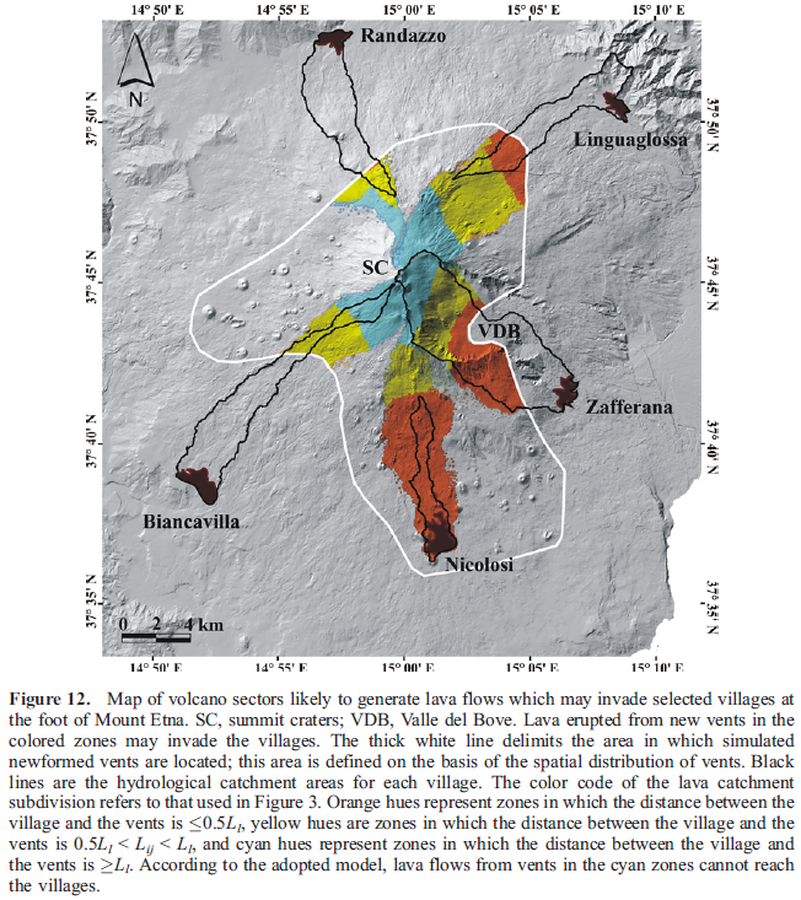
Figure in a journal article
Map of volcano sectors likely to generate lava flows which may invade selected villages at the foot of Mount Etna. SC, summit craters; VDB, Valle del Bove
Figure 12 in: Favalli, M., Mazzarini, F., Pareschi, M. T., & Boschi, E. (2009). Topographic control on lava flow paths at Mount Etna, Italy: implications for hazard assessment. Journal of Geophysical Research: Earth Surface, 114(F1). https://doi.org/10.1029/2007JF000918
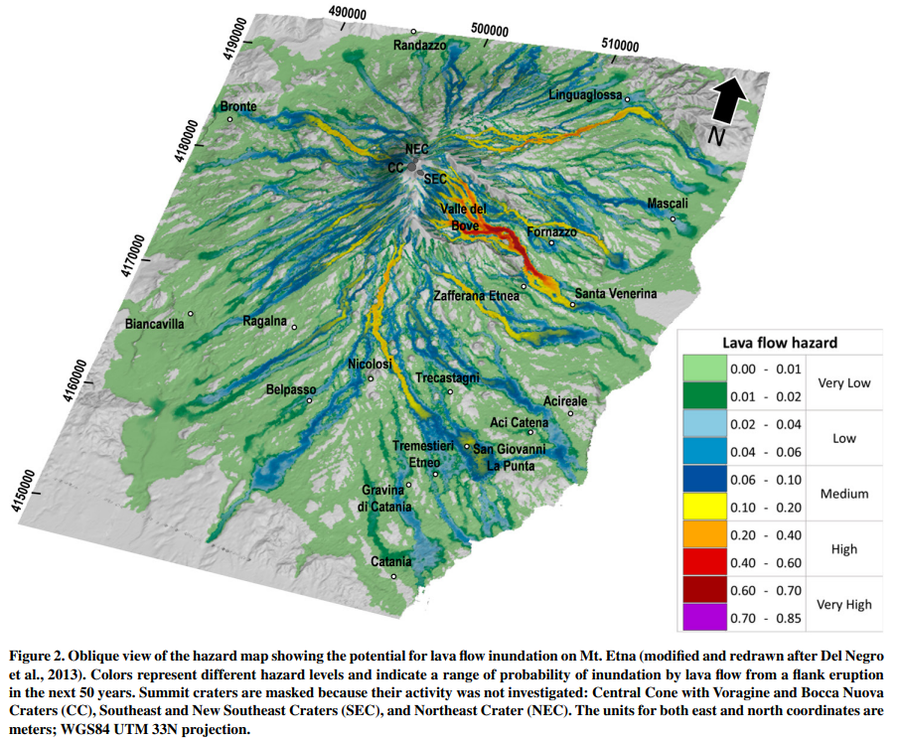
Figure in a journal article
Oblique view of the hazard map showing the potential for lava flow inundation on Mt. Etna
Figure 2 in: Del Negro, C., Cappello, A., Bilotta, G., Ganci, G., Hérault, A., & Zago, V. (2020). Living at the edge of an active volcano: Risk from lava flows on Mt. Etna. GSA Bulletin, 132(7-8), 1615-1625. https://doi.org/10.1130/B35290.1
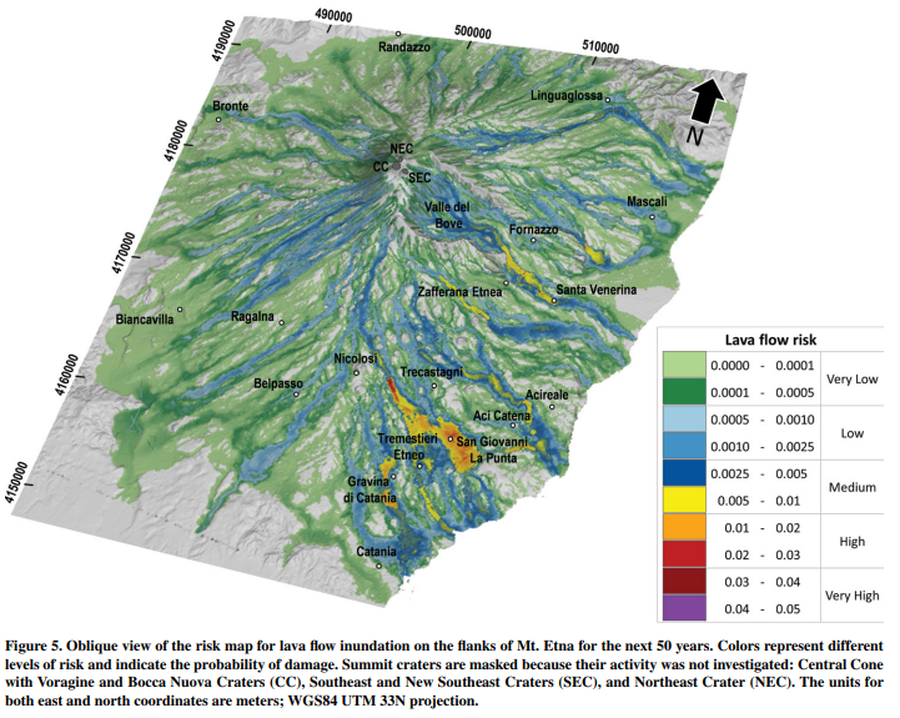
Figure in a journal article
Oblique view of the risk map for lava flow inundation on the flanks of Mt. Etna for the next 50 years
Figure 5 in: Del Negro, C., Cappello, A., Bilotta, G., Ganci, G., Hérault, A., & Zago, V. (2020). Living at the edge of an active volcano: Risk from lava flows on Mt. Etna. GSA Bulletin, 132(7-8), 1615-1625. https://doi.org/10.1130/B35290.1
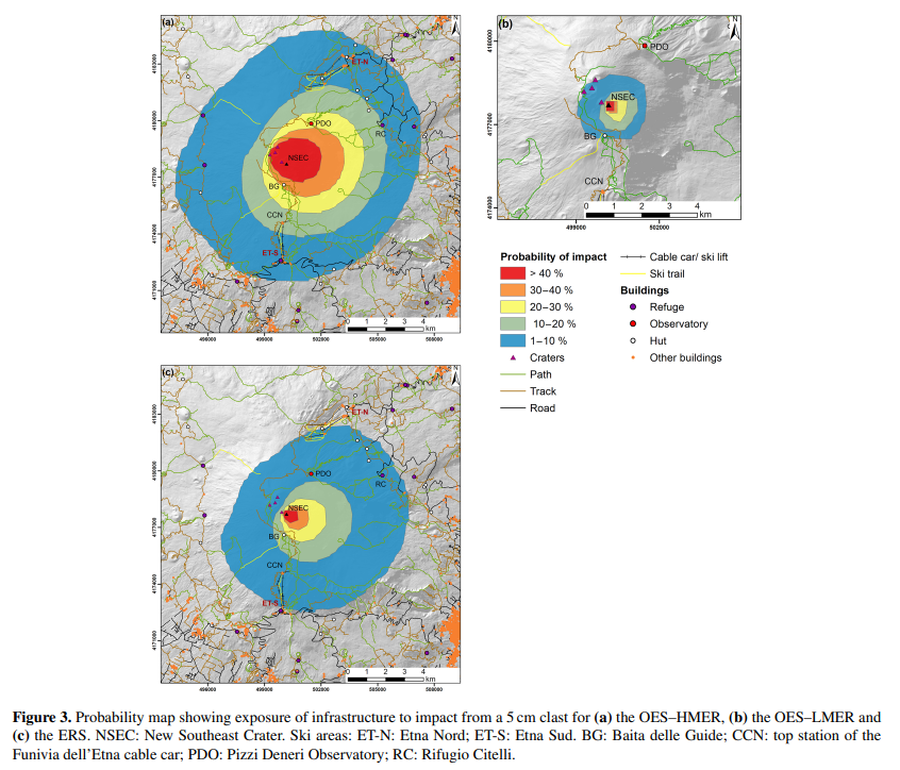
Figure in a journal article
Probability map showing exposure of infrastructure to impact from a 5 cm clast
Figure 3 in: Osman, S., Rossi, E., Bonadonna, C., Frischknecht, C., Andronico, D., Cioni, R., & Scollo, S. (2019). Exposure-based risk assessment and emergency management associated with the fallout of large clasts at Mount Etna. Natural Hazards and Earth System Sciences, 19(3), 589-610. https://doi.org/10.5194/nhess-19-589-2019

Figure in a journal article
Spatiotemporal probability map of vent opening at Mt. Etna for the next 10 years within the summit area
Figure 4 in: Del Negro, C., Cappello, A., Neri, M., Bilotta, G., Hérault, A., & Ganci, G. (2013). Lava flow hazards at Mount Etna: constraints imposed by eruptive history and numerical simulations. Scientific Reports, 3(1). https://doi.org/10.1038/srep03493
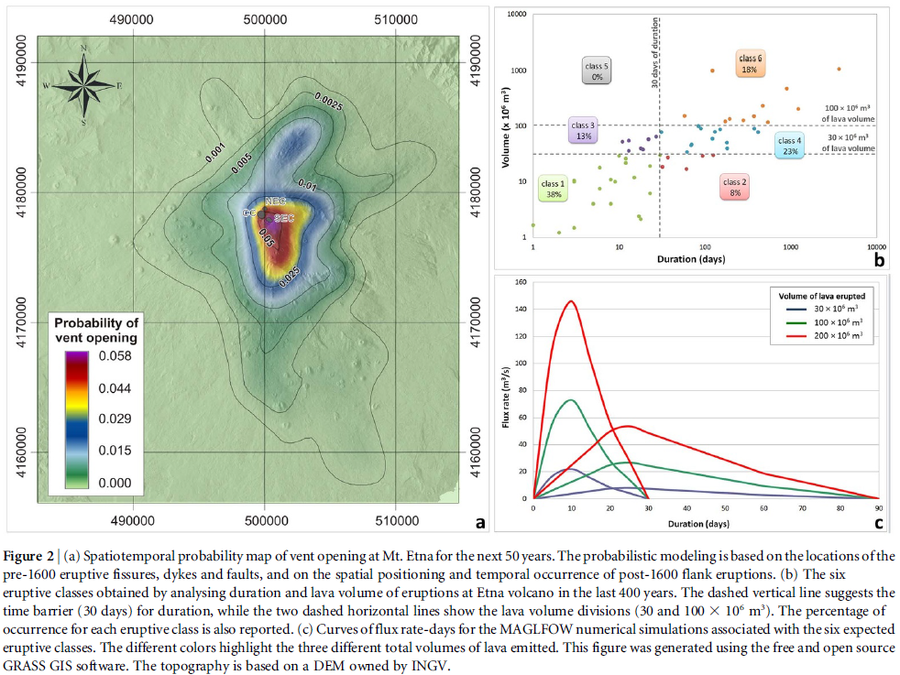
Figure in a journal article
Spatiotemporal probability map of vent opening at Mt. Etna for the next 50 years
Figure 2 in: Del Negro, C., Cappello, A., Neri, M., Bilotta, G., Hérault, A., & Ganci, G. (2013). Lava flow hazards at Mount Etna: constraints imposed by eruptive history and numerical simulations. Scientific Reports, 3(1). https://doi.org/10.1038/srep03493
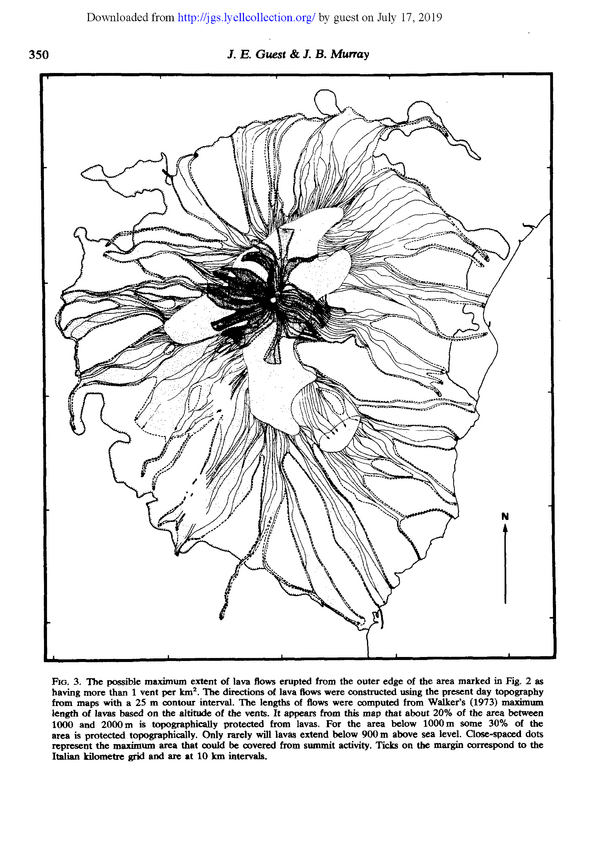
Figure in a journal article
The possible maximum extent of lava flows erupted from the outer edge of the area marked in Fig, 2 as having more than 1 vent per km²
Figure 3 in: Guest, J.E. & Murray, J.B. (1979). An analysis of hazard from Mount Etna volcano. Journal of the Geological Society, 136(3), p. 347-354. https://doi.org/10.1144/gsjgs.136.3.0347
Page: 1 2
