← Back to Search Results

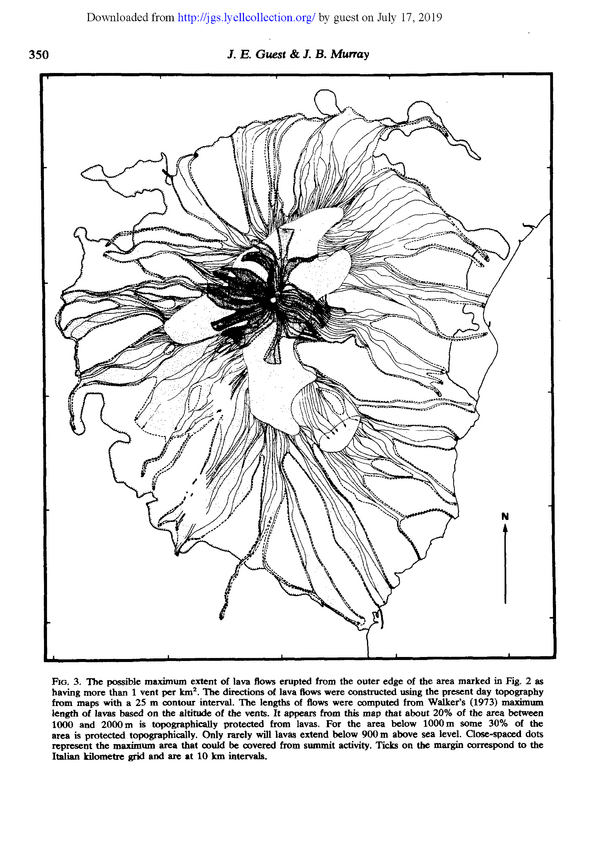
The possible maximum extent of lava flows erupted from the outer edge of the area marked in Fig, 2 as having more than 1 vent per kmĀ²

Etna, Italy, 1979

Figure 3 in: Guest, J.E. & Murray, J.B. (1979). An analysis of hazard from Mount Etna volcano. Journal of the Geological Society, 136(3), p. 347-354. https://doi.org/10.1144/gsjgs.136.3.0347


This hazard map is the result of scientific research and was published in academic literature. It is presented here to serve as an example of the map type or the map-making methodology. It is NOT the official, operational map. For the current operational hazard map, please consult the proper institutional authorities.


Click on thumbnail for full-size map. We do not have copyright permission to display the full-size image. If you are the copyright holder and wish to provide copyright, please contact us at admin@volcanichazardmaps.org. If link seems broken, try the archived version.

Map Data

Map ID551
Hazard Process(es)Lava flows; Unstated or all hazards
Hazard Zone PresentationSingle hazard: A single hazard process is represented on a main map panel
Temporal ScaleBackground, or long-term, map
Spatial ScaleIsland
Publication FormatFigure in a journal article
Zonation Method(s)Geologic history; Scenario modeling
Zonation Model(s)Unnamed empirical altitude-length lava flow model (Walker 1973; Walker 1974)
Scenario(s) ConsideredSize, VEI, or intensity; Source location or direction; Worst-case
Hazard Zone Label(s)Hazard process name; Scenario name
Probability Definition(s)Qualitative relative probability (e.g. high-medium-low); Scenarios imply probability
PurposeMultiple: intended for multiple purposes including general hazard awareness, planning, and crisis management
AudienceScientists (usually in scientific publication)
Language(s)English
Basemap(s)Simple or sketch map
Basemap overlay(s)
DiemsionalityPlanimetric (2D or map) view
Color SchemeSymbols and/or lines only
Go to Global Volcanism Program page for Etna →