
Advanced Search for Maps
Showing 41-50 of 93
Official, Figure in hazard assessment
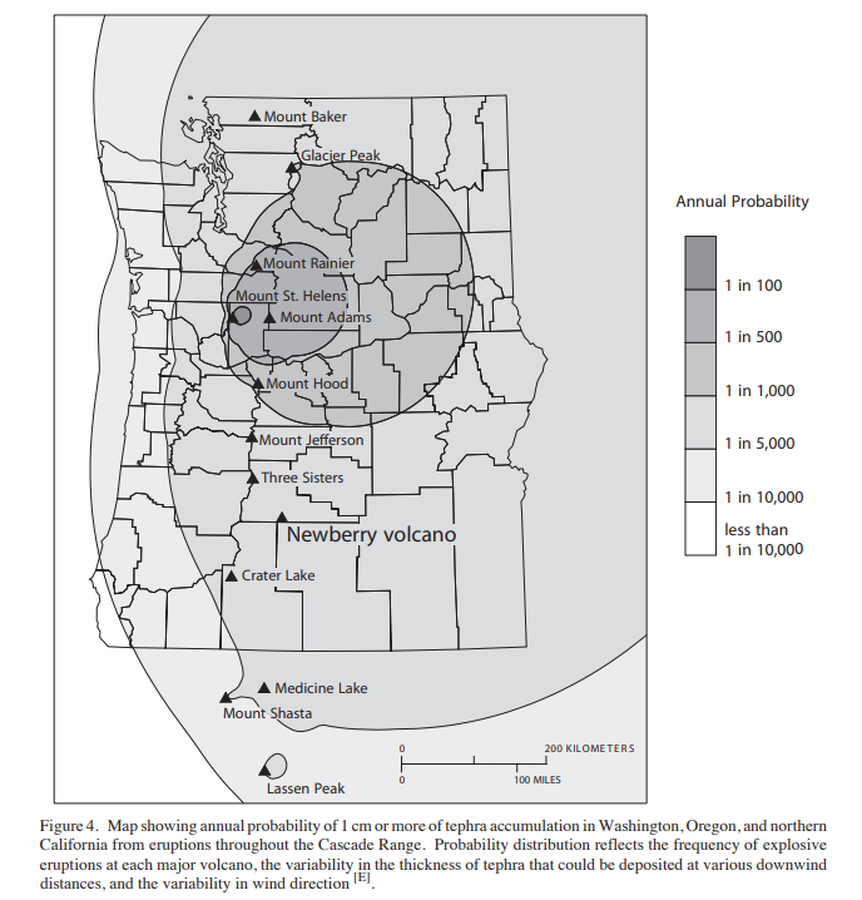
Map showing annual probability of 1 cm or more of tephra accumulation in Washington, Oregon, and northern California from eruptions throughout the Cascade Range.
Figure 4 in: Sherrod, D.R., Mastin, L.G., Scott, W.E. & Schilling, S.P. (1997). Volcano hazards at Newberry Volcano, Oregon. U.S. Geological Survey, Open-File Report 97-513, 14 p. https://doi.org/10.3133/ofr97513

Official, Figure on website
Map showing caldera features and caldera-related hazards at Medicine Lake volcano
U.S. Geological Survey (USGS). (2008). Map showing caldera features and caldera-related hazards at Medicine Lake volcano. U.S. Geological Survey. Medicine Lake Hazards. https://www.usgs.gov/volcanoes/medicine-lake/hazards (Modified from: Scientitic Investigations Report 2007-5174-A)

Official, Figure in hazard assessment
Map showing caldera features and caldera-related hazards at Medicine Lake volcano
Figure 13 in: Donnelly-Nolan, J.M., Nathenson, M., Champion, D.E., Ramsey, D.W., Lowenstern, J.B., & Ewert, J.W. (2007). Volcano Hazards Assessment for Medicine Lake Volcano, Northern California. Scientitic Investigations Report 2007-5174-A. Plate 1. https://doi.org/10.3133/sir20075174A
Official, Figure on website
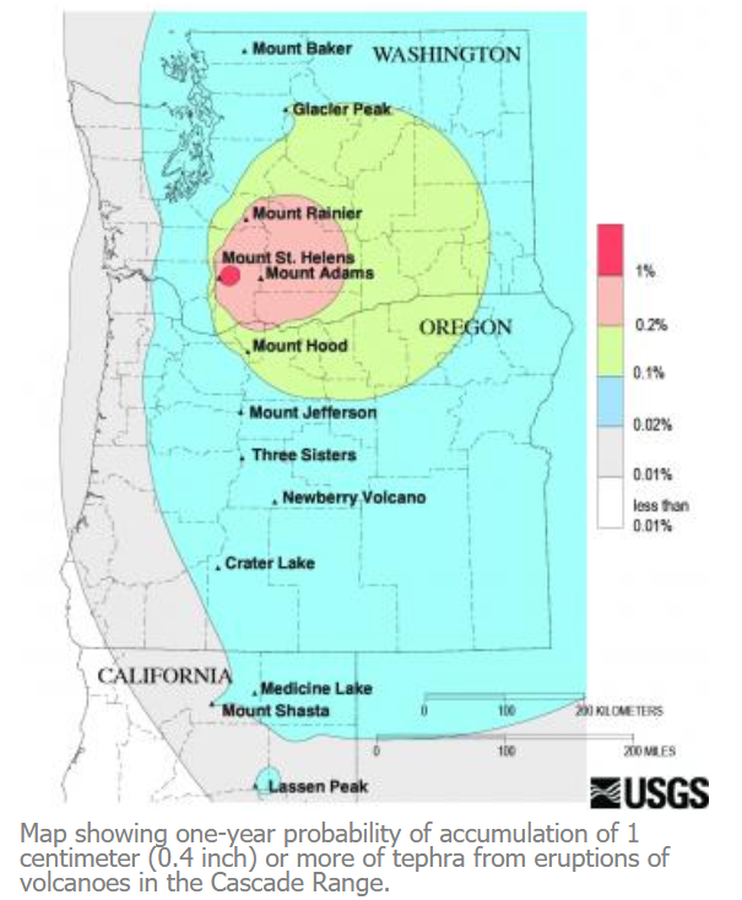
Map showing one-year probability of accumulation of 1 centimeter (0.4 inch) or more of tephra from eruptions of volcanoes in the Cascade Range.
Nathensen, M. (2013). Map showing one-year probability of accumulation of 1 centimeter (0.4 inch) or more of tephra from eruptions of volcanoes in the Cascade Range. U.S. Geological Survey. Mount Bachelor Hazards. https://www.usgs.gov/volcanoes/mount-bachelor/hazards
Official, Figure in hazard assessment
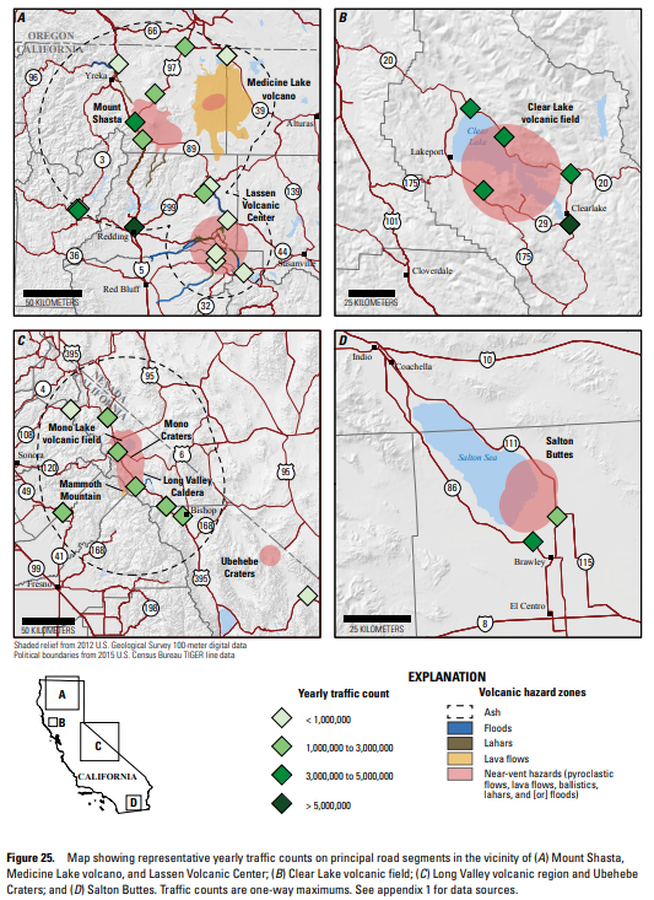
Map showing representative yearly traffic counts on principal road segments in the vicinity of (A) Mount Shasta, Medicine Lake volcano, and Lassen Volcanic Center; (B) Clear Lake volcanic field; (C ) Long Valley volcanic region and Ubehebe Craters; and (D) Salton Buttes
Figure 25 in: Mangan, M., Ball, J., Wood, N., Jones, J.L., Peters, J., Abdollahian, N., Dinitz, L., Blankenheim, S., Fenton, J., & Pridmore, C. (2019). California’s exposure to volcanic hazards. U.S. Geological Survey Scientific Investigations Report 2018–5159, v. 1.1, 49 p. https://doi.org/10.3133/sir20185159
Official, Figure on website
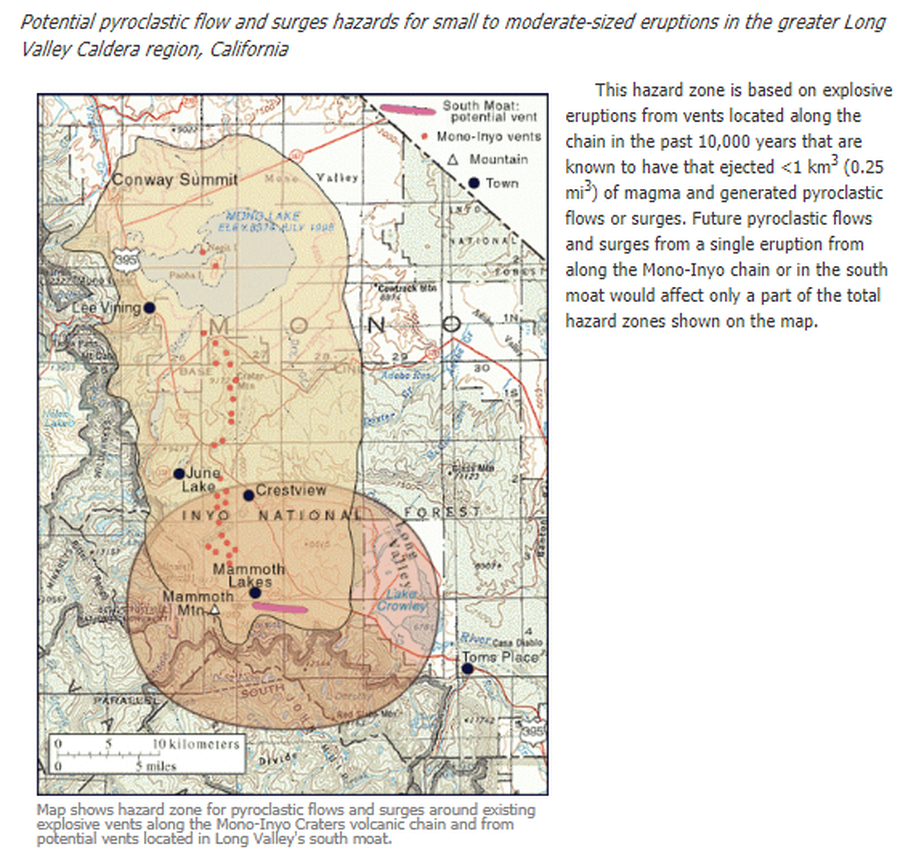
Map shows hazard zone for pyroclastic flows and surges around existing explosive vents along the Mono-Inyo Craters volcanic chain and from potential vents located in Long Valley's south moat
U.S. Geological Survey (USGS). (2012). Map shows hazard zone for pyroclastic flows and surges around existing explosive vents along the Mono-Inyo Craters volcanic chain and from potential vents located in Long Valley's south moat. U.S. Geological Survey. Long Valley Caldera Hazards, Pyroclastic Flow and Surge Hazard Zones from Potential Vents in Long Valley Caldera, California. https://www.usgs.gov/volcanoes/long-valley-caldera/pyroclastic-flow-and-surge-hazard-zones-potential-vents-long-valley
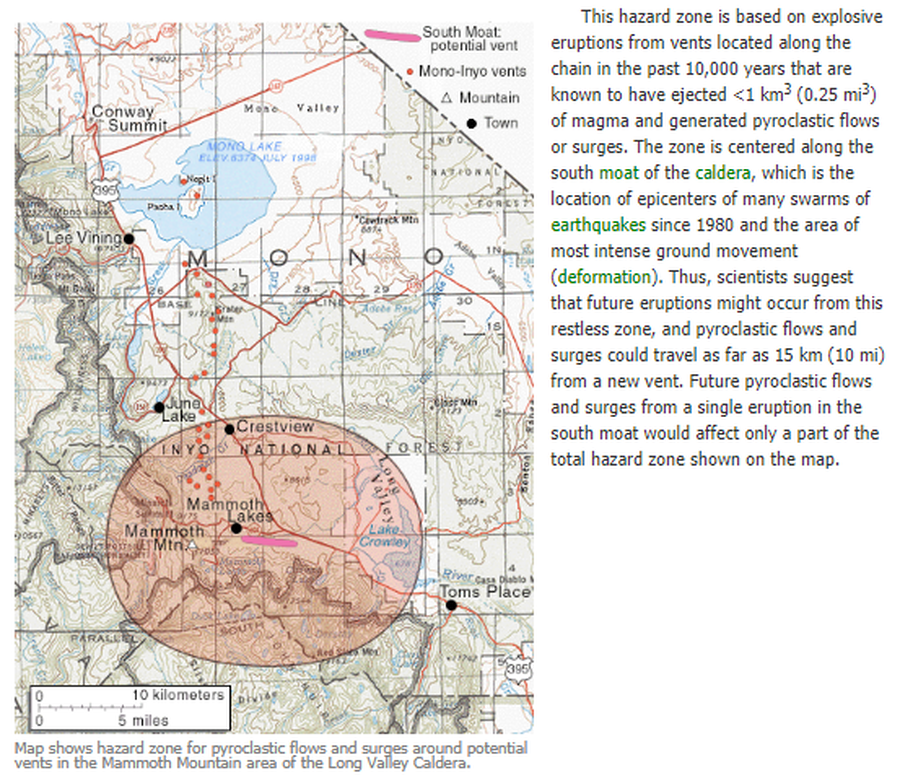
Official, Figure on website
Map shows hazard zone for pyroclastic flows and surges around potential vents in the Mammoth Mountain area of the Long Valley Caldera
U.S. Geological Survey (USGS). (2012). Map shows hazard zone for pyroclastic flows and surges around potential vents in the Mammoth Mountain area of the Long Valley Caldera. U.S. Geological Survey. Long Valley Caldera Hazards, Pyroclastic Flow and Surge Hazard Zones from Potential Vents in Long Valley Caldera, California. https://www.usgs.gov/volcanoes/long-valley-caldera/pyroclastic-flow-and-surge-hazard-zones-potential-vents-long-valley
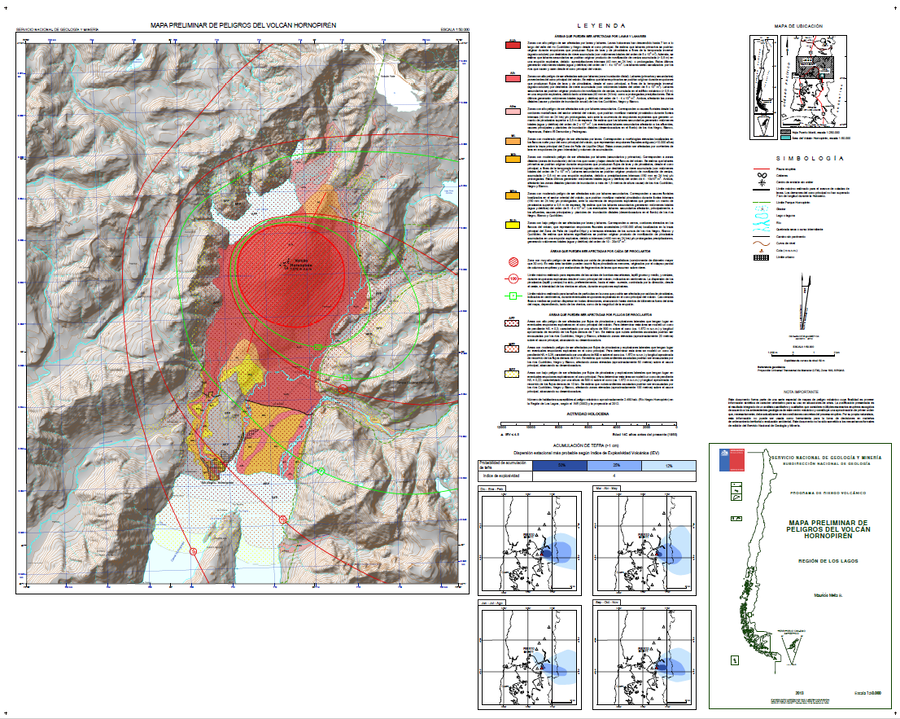
Official, Map sheet or poster
Mapa Preliminar de Peligros del Volcán Hornopirén
(Preliminary Hazard Map of Hornopirén Volcano)
Mella, M. (2013). Mapa Preliminar de Peligros del Volcán Hornopirén, Región de los Lagos. Subdirección Nacional de Geología, Programa de Riesgo Volcánico, mapa escala 1:50,000. Santiago.
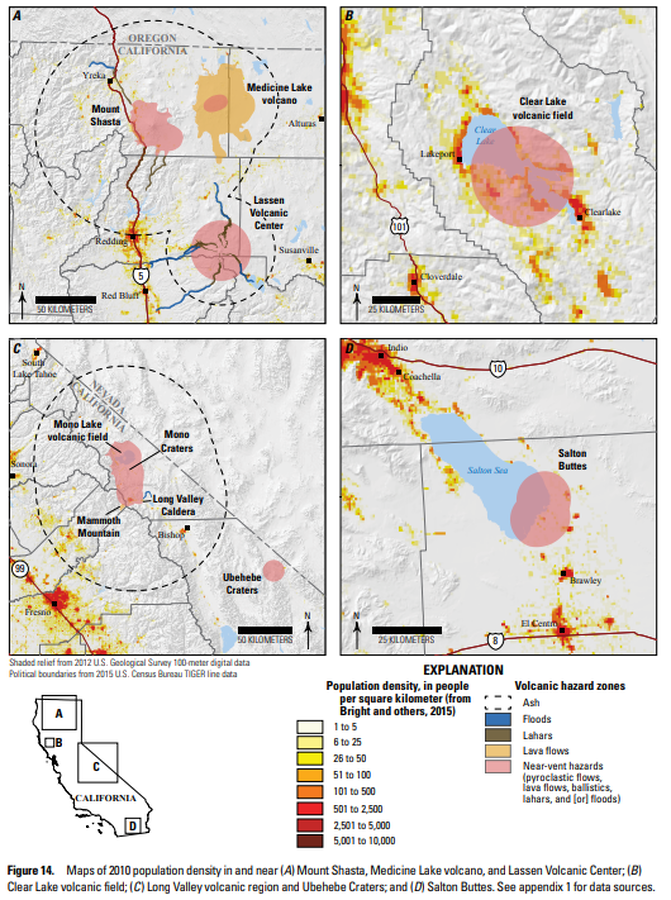
Official, Figure in hazard assessment
Maps of 2010 population density in and near (A) Mount Shasta, Medicine Lake volcano, and Lassen Volcanic Center; (B ) Clear Lake volcanic field; (C ) Long Valley volcanic region and Ubehebe Craters; and (D ) Salton Buttes
Figure 14 in: Mangan, M., Ball, J., Wood, N., Jones, J.L., Peters, J., Abdollahian, N., Dinitz, L., Blankenheim, S., Fenton, J., & Pridmore, C. (2019). California’s exposure to volcanic hazards. U.S. Geological Survey Scientific Investigations Report 2018–5159, v. 1.1, 49 p. https://doi.org/10.3133/sir20185159
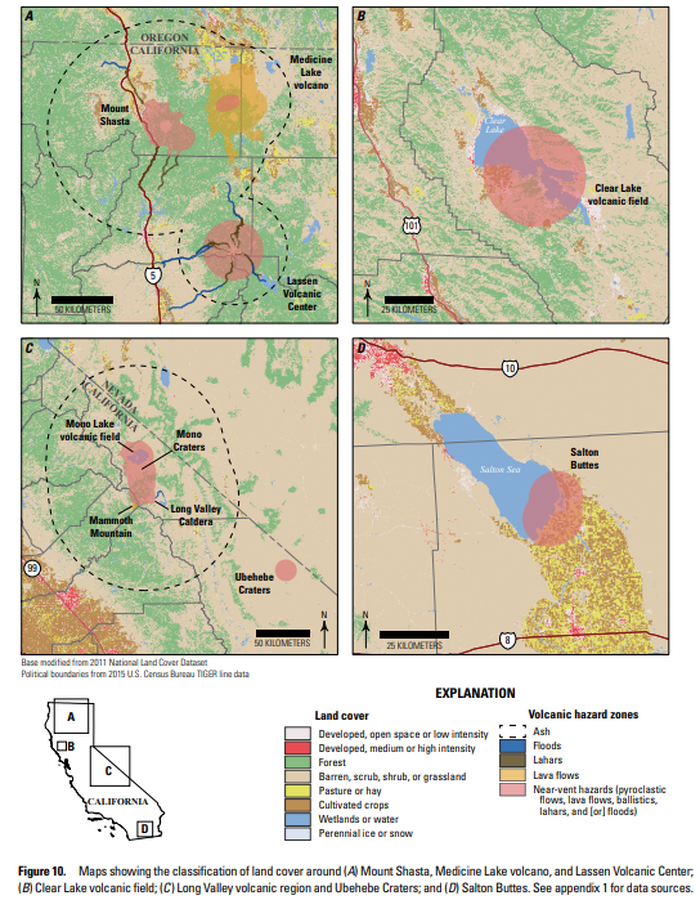
Official, Figure in hazard assessment
Maps showing the classification of land cover around (A) Mount Shasta, Medicine Lake volcano, and Lassen Volcanic Center; (B) Clear Lake volcanic field; (C ) Long Valley volcanic region and Ubehebe Craters; and (D) Salton Buttes
Figure 10 in: Mangan, M., Ball, J., Wood, N., Jones, J.L., Peters, J., Abdollahian, N., Dinitz, L., Blankenheim, S., Fenton, J., & Pridmore, C. (2019). California’s exposure to volcanic hazards. U.S. Geological Survey Scientific Investigations Report 2018–5159, v. 1.1, 49 p. https://doi.org/10.3133/sir20185159