
Advanced Search for Maps
Showing 41-50 of 141
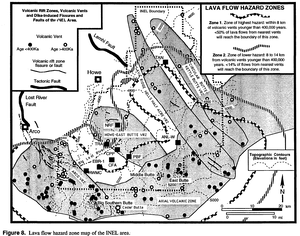
Official, Figure in hazard assessment
Lava flow hazard zone map of the INEL area
Figure 8 in: Hackett, W.R. & Smith, R.P. (1994). Volcanic hazards of the Idaho National Engineering Laboratory and adjacent areas (No. INEL--94/0276). Lockheed Martin Idaho Technologies Co..
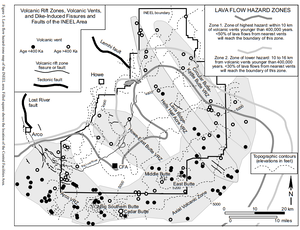
Official, Figure in hazard assessment
Lava Flow Hazard Zones
Figure 5 in: Hackett, W.R., Smith, R.P., & Khericha, S. (2002). Volcanic hazards of the Idaho National Engineering and Environmental Laboratory, southeast Idaho. In: Bonnichsen, B., White, C.M., and McCurry, M. (eds.). Tectonic and Magmatic Evolution of the Snake River Plain Volcanic Province. Idaho Geological Survey Bulletin 30, p. 461-482.
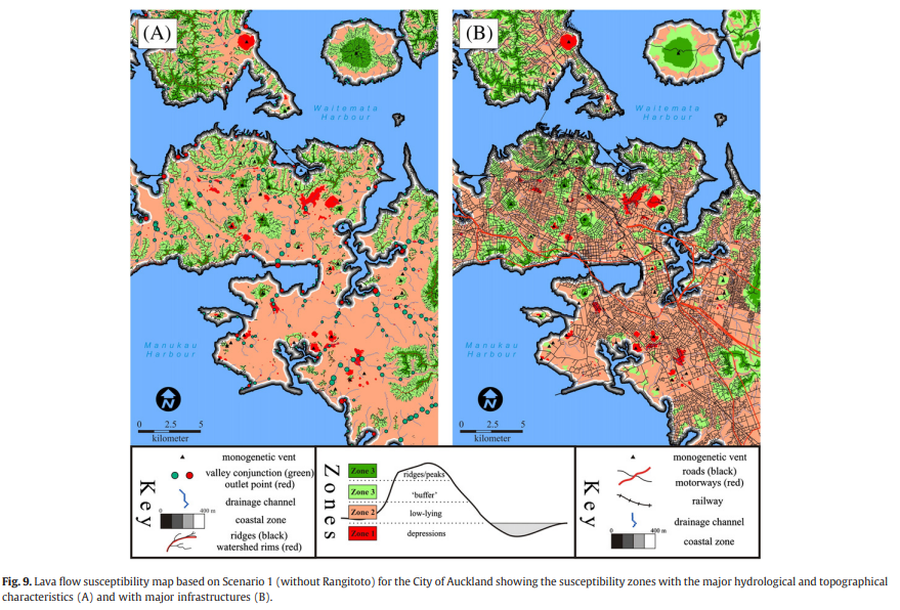
Figure in a journal article
Lava flow susceptibility map based on Scenario 1 (without Rangitoto) for the City of Auckland showing the susceptibility zones with the major hydrological and topographical characteristics and with major infrastructures
Figure 9 in: Kereszturi, G., Procter, J., Cronin, S. J., Németh, K., Bebbington, M., & Lindsay, J. (2012). LiDAR-based quantification of lava flow susceptibility in the City of Auckland (New Zealand). Remote Sensing of Environment, 125, 198-213. https://doi.org/10.1016/j.rse.2012.07.015
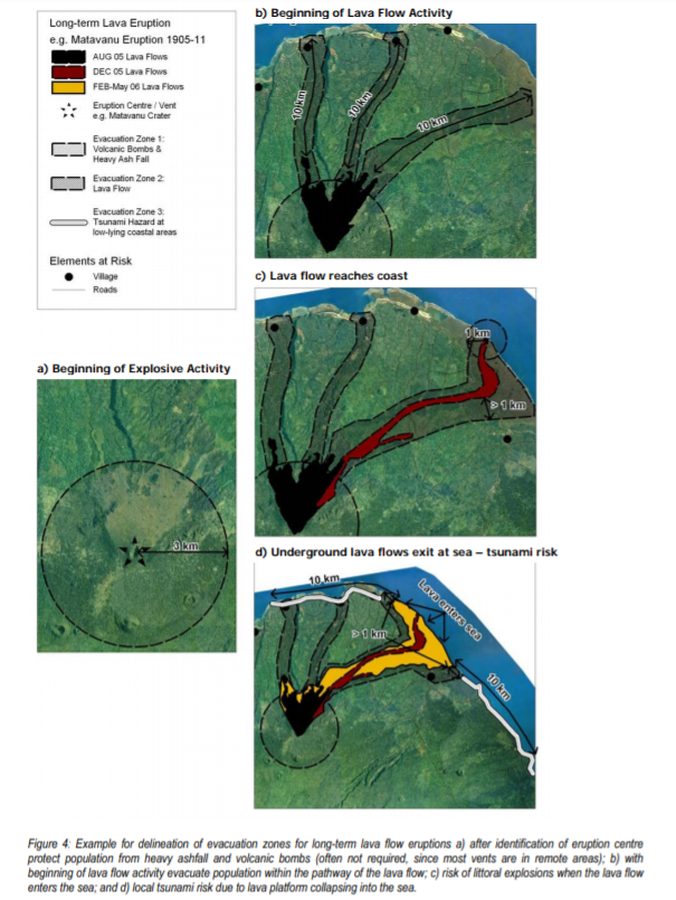
Official, Figure in hazard assessment
Long-term Lava Eruption e.g. Matavanu Eruption 1905-11
Figure 4 in: Cronin, S., Bonte-Grapentin, M. & Nemeth, K. (2006). Samoa technical report - Review of volcanic hazard maps for Savai'i and Upolu. Pacific Islands Applied Geoscience Commission (SOPAC) Project Report 59.

Official, Sign or billboard
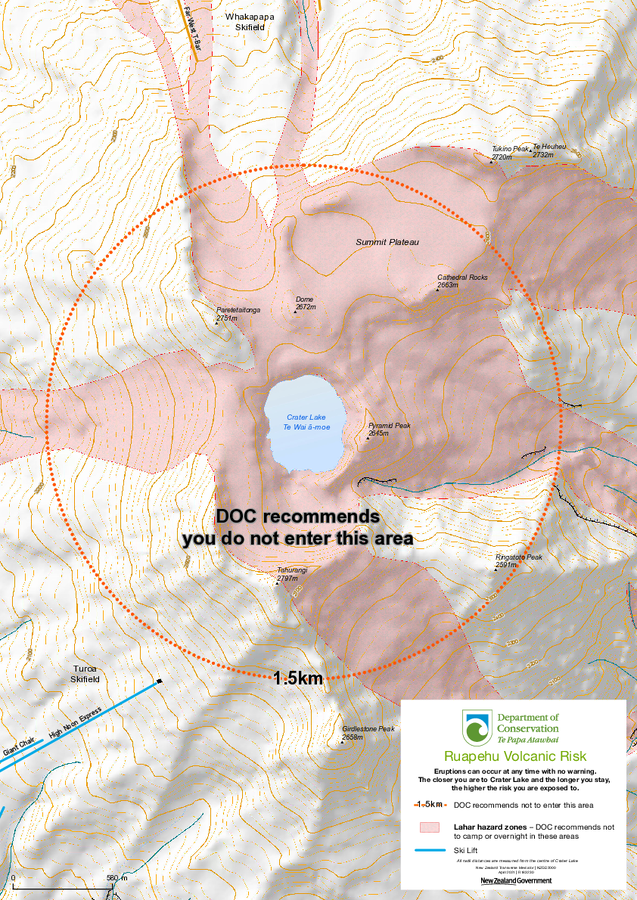
Map of areas not recommended not to enter or camp at Risk Management Stage A - VAL 1
Department of Conservation. (2020). Map of areas not recommended not to enter or camp at Risk Management Stage A - VAL 1. September 2020 R183230.
Official, Sign or billboard
Map of areas not recommended not to enter or camp at Risk Management Stage B - VAL 1
Department of Conservation. (2020). Map of areas not recommended not to enter or camp at Risk Management Stage B - VAL 1.
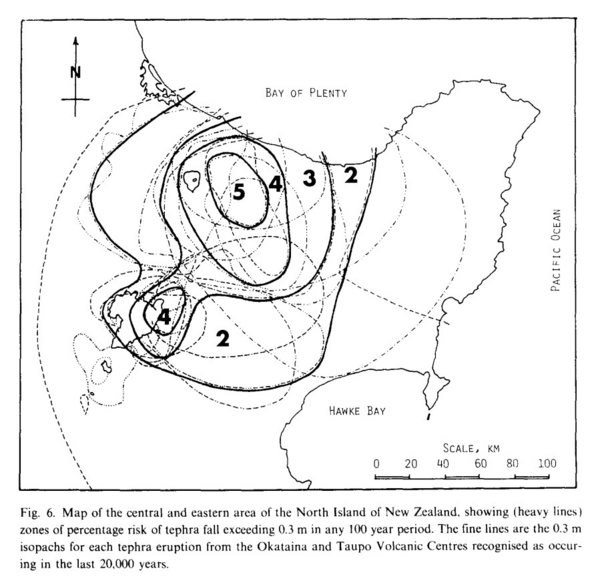
Figure in a journal article
Map of the central and eastern area of the North Island of New Zealand, showing (heavy lines) zones of percentage risk of tephra fall exceeding 0.3 m in any 100 year period
Figure 6 in: Dibble, R.R., Nairn, I.A., & Neall, V.E. (1985). Volcanic hazards of North Island, New Zealand--Overview. Journal of Geodynamics, 3, p. 369-396. https://doi.org/10.1016/0264-3707(85)90043-2
Official, Map in a booklet, long fact-sheet, or handbook
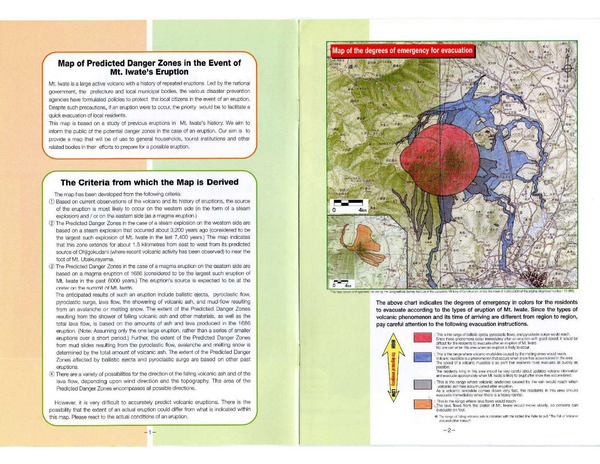
Map of the degrees of emergency for evacuation
The Counter-measures Investigation Committee on Volcanic Disasters at Mt. Iwate. (1998). Mt. Iwate Volcanic Disaster Prevention Handbook. 8 p.
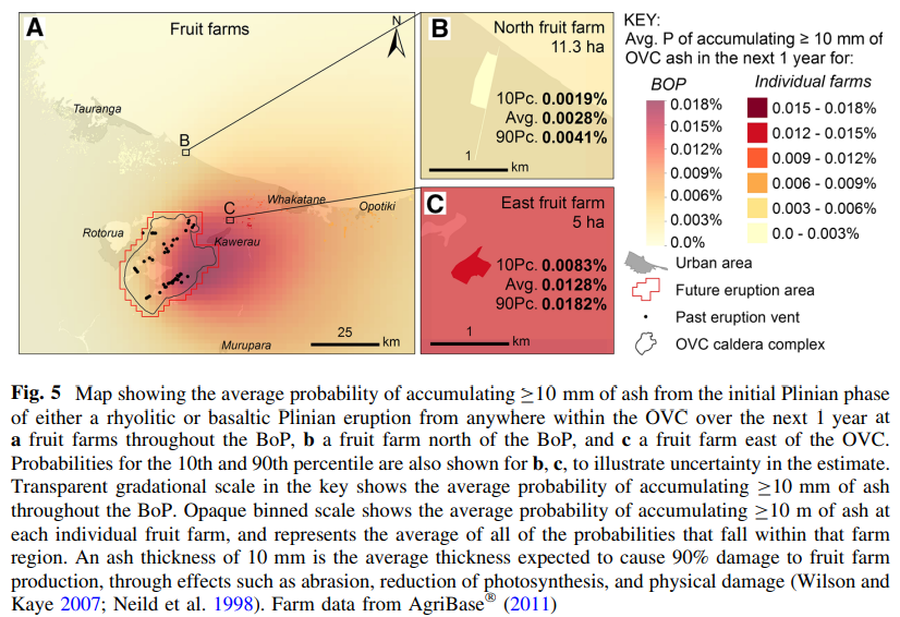
Figure in a journal article
Map showing the average probability of accumulating C10 mm of ash from the initial Plinian phase of either a rhyolitic or basaltic Plinian eruption from anywhere within the OVC over the next 1 year
Figure 5 in: Thompson, M. A., Lindsay, J. M., Wilson, T. M., Biass, S., & Sandri, L. (2017). Quantifying risk to agriculture from volcanic ashfall: a case study from the Bay of Plenty, New Zealand. Natural Hazards, 86(1), 31-56. https://doi.org/10.1007/s11069-016-2672-7
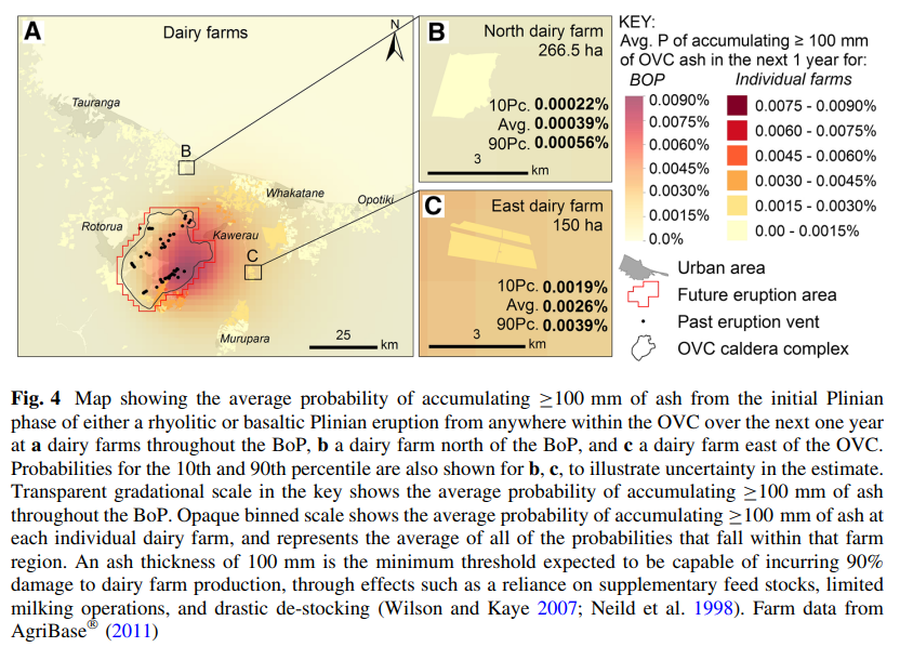
Figure in a journal article
Map showing the average probability of accumulating ≥100 mm of ash from the initial Plinian phase of either a rhyolitic or basaltic Plinian eruption from anywhere within the OVC over the next one year
Figure 4 in: Thompson, M. A., Lindsay, J. M., Wilson, T. M., Biass, S., & Sandri, L. (2017). Quantifying risk to agriculture from volcanic ashfall: a case study from the Bay of Plenty, New Zealand. Natural Hazards, 86(1), 31-56. https://doi.org/10.1007/s11069-016-2672-7