
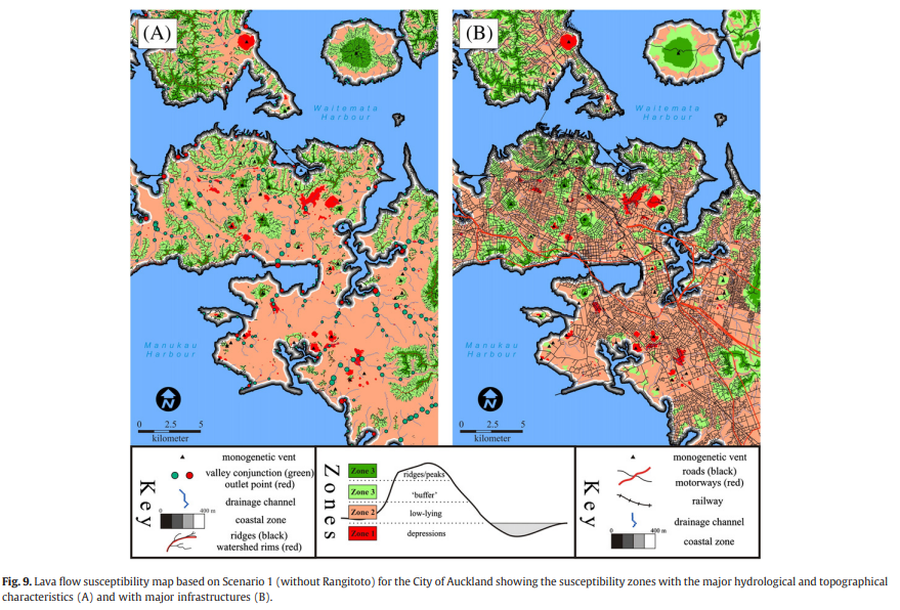
Lava flow susceptibility map based on Scenario 1 (without Rangitoto) for the City of Auckland showing the susceptibility zones with the major hydrological and topographical characteristics and with major infrastructures
Auckland Volcanic Field, New Zealand, 2012
Figure 9 in: Kereszturi, G., Procter, J., Cronin, S. J., Németh, K., Bebbington, M., & Lindsay, J. (2012). LiDAR-based quantification of lava flow susceptibility in the City of Auckland (New Zealand). Remote Sensing of Environment, 125, 198-213. https://doi.org/10.1016/j.rse.2012.07.015
This hazard map is the result of scientific research and was published in academic literature.
It is presented here to serve as an example of the map type or the map-making methodology. It is NOT the official, operational map. For the current operational hazard map, please consult the proper institutional authorities.
Click on thumbnail for full-size map. We do not have copyright permission to display the full-size image. If you are the copyright holder and wish to provide copyright, please contact us at admin@volcanichazardmaps.org.