
Advanced Search for Maps
Showing 51-60 of 131

Official, Map sheet or poster
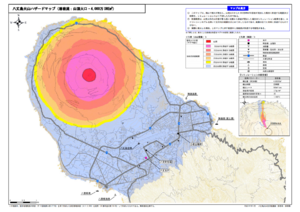
Hachijojima Volcano Hazard Map (Lava flow: Summit crater, 4 million m³ DRE)
Hachijojima Volcano Disaster Prevention Council. (2017). Hachijojima volcano hazard map. Disaster Prevention Division, Bureau of General Affairs, Tokyo Metropolitan Government.
Official, Map sheet or poster
Hachijojima Volcano Hazard Map (Lava flow: Summit crater, 40 million m³ DRE)
Hachijojima Volcano Disaster Prevention Council. (2017). Hachijojima volcano hazard map. Disaster Prevention Division, Bureau of General Affairs, Tokyo Metropolitan Government.
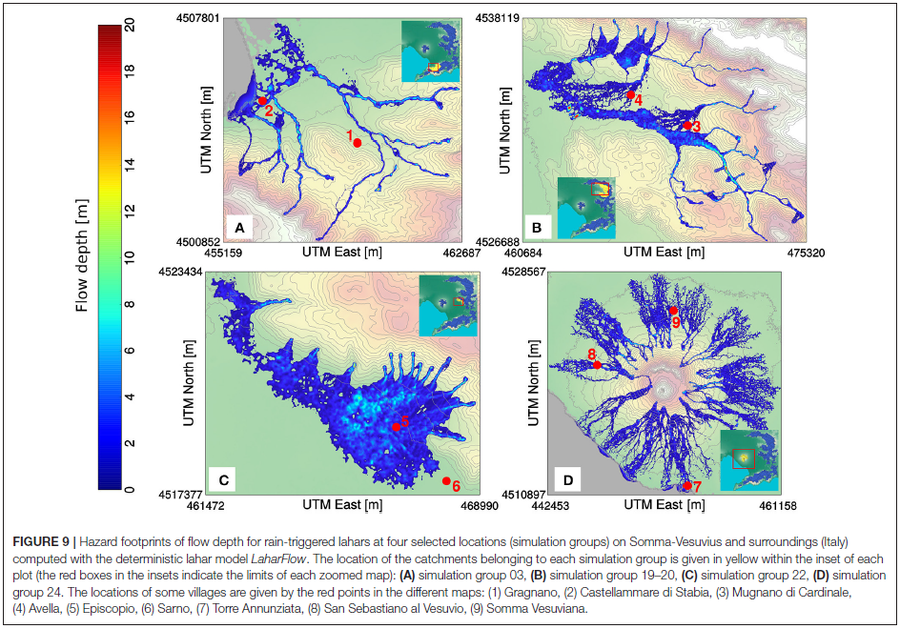
Figure in a journal article
Hazard footprints of flow depth for rain-triggered lahars at four selected locations (simulation groups) on Somma-Vesuvius and surroundings (Italy) computed with the deterministic lahar model LaharFlow
Figure 9 in: Tierz, P., Woodhouse, M.J., Phillips, J.C., Sandri, L., Selva, J., Marzocchi, W., & Odbert, H.M. (2017). A framework for probabilistic multi-hazard assessment of rain-triggered lahars using Bayesian belief networks. Frontiers in Earth Science, 5 (73). https://doi.org/10.3389/feart.2017.00073
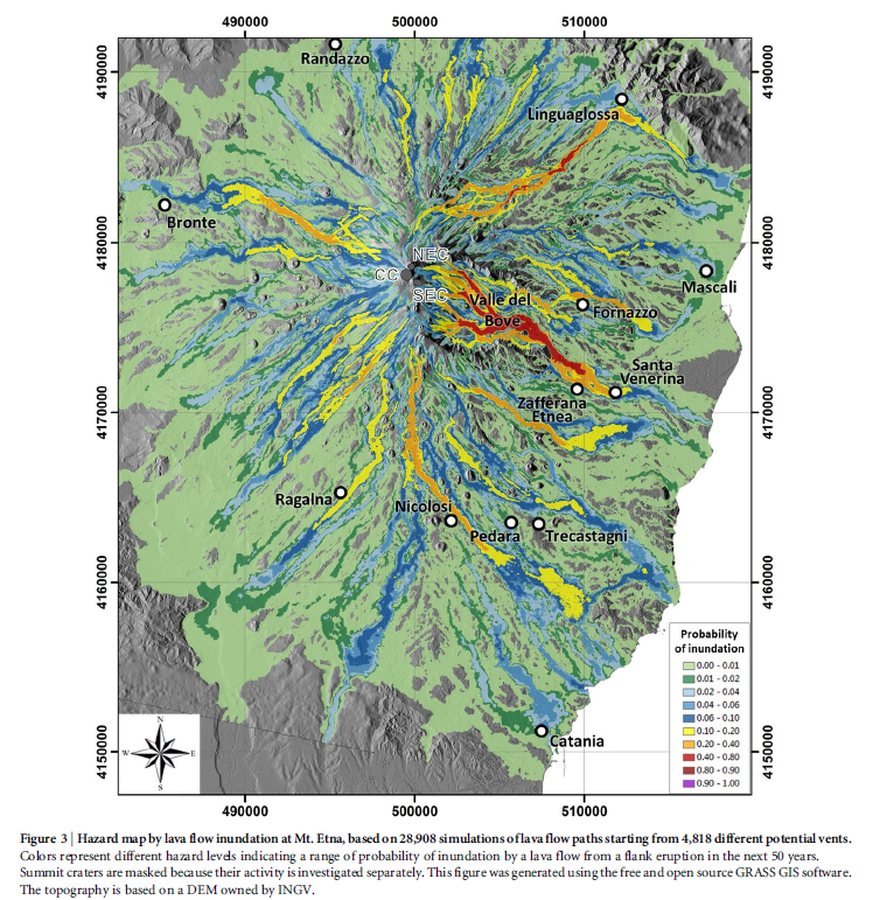
Figure in a journal article
Hazard map by lava flow inundation at Mt. Etna, based on 28,908 simulations of lava flow paths starting from 4,818 different potential vents.
Figure 3 in: Del Negro, C., Cappello, A., Neri, M., Bilotta, G., Hérault, A., & Ganci, G. (2013). Lava flow hazards at Mount Etna: constraints imposed by eruptive history and numerical simulations. Scientific Reports, 3(1). https://doi.org/10.1038/srep03493
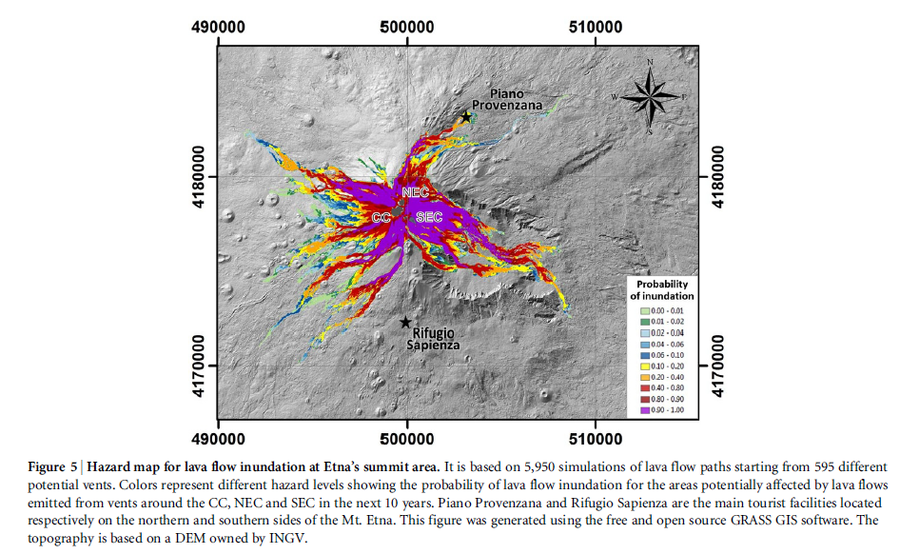
Figure in a journal article
Hazard map for lava flow inundation at Etna’s summit area.
Figure 5 in: Del Negro, C., Cappello, A., Neri, M., Bilotta, G., Hérault, A., & Ganci, G. (2013). Lava flow hazards at Mount Etna: constraints imposed by eruptive history and numerical simulations. Scientific Reports, 3(1). https://doi.org/10.1038/srep03493
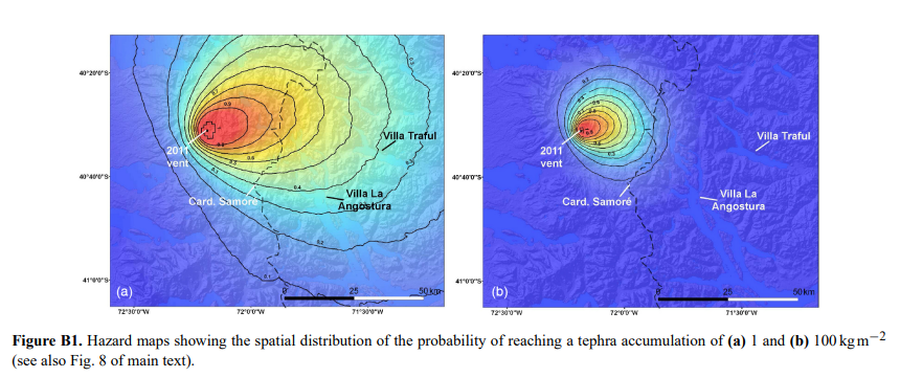
Figure in a journal article
Hazard maps showing the spatial distribution of the probability of reaching a tephra accumulation of (a) 1 and (b) 100 kg m−2
Figure B1 in: Elissondo, M., Baumann, V., Bonadonna, C., Pistolesi, M., Cioni, R., Bertagnini, A., Biass, S., Herrero, J.-C., & Gonzalez, R. (2016). Chronology and impact of the 2011 Cordón Caulle eruption, Chile. Natural Hazards and Earth System Sciences, 16(3), 675-704. https://doi.org/10.5194/nhess-16-675-2016, 2016
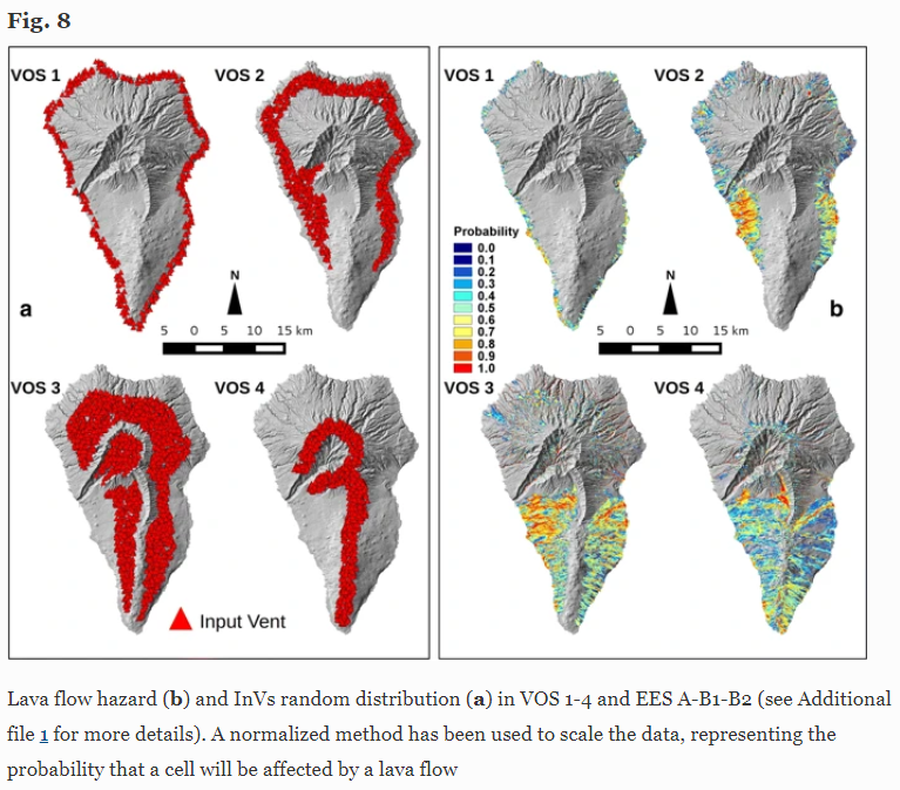
Figure in a journal article
Lava flow hazard
Figure 8 in: Marrero, J. M., García, A., Berrocoso, M., Llinares, Á., Rodríguez-Losada, A., & Ortiz, R. (2019). Strategies for the development of volcanic hazard maps in monogenetic volcanic fields: the example of La Palma (Canary Islands). Journal of Applied Volcanology, 8(1), 6. https://doi.org/10.1186/s13617-019-0085-5
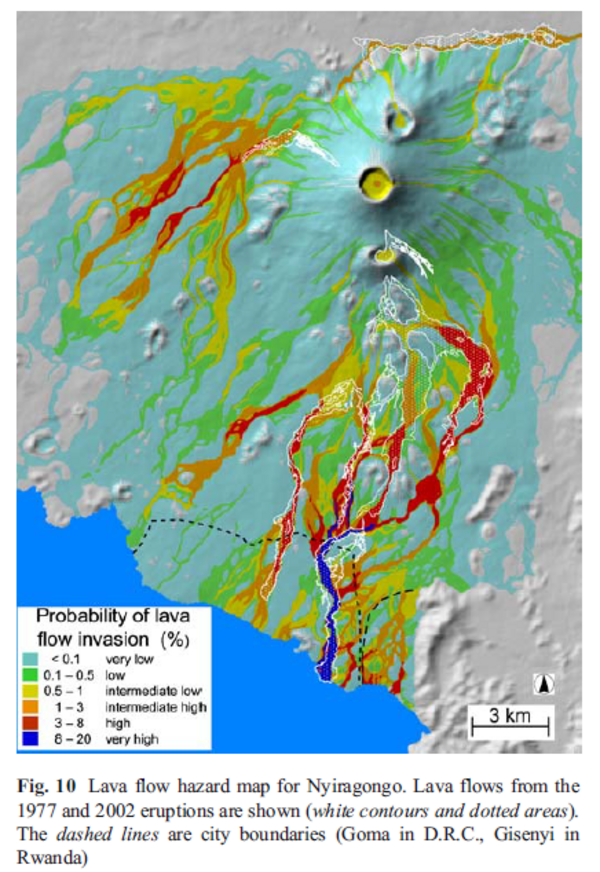
Figure in a journal article
Lava flow hazard map for Nyiragongo
Figure 10 in: Favalli, M., Chirico, G. D., Papale, P., Pareschi, M. T., & Boschi, E. (2009). Lava flow hazard at Nyiragongo volcano, DRC. Bulletin of volcanology, 71(4), p. 363-374. https://doi.org/10.1007/s00445-008-0233-y
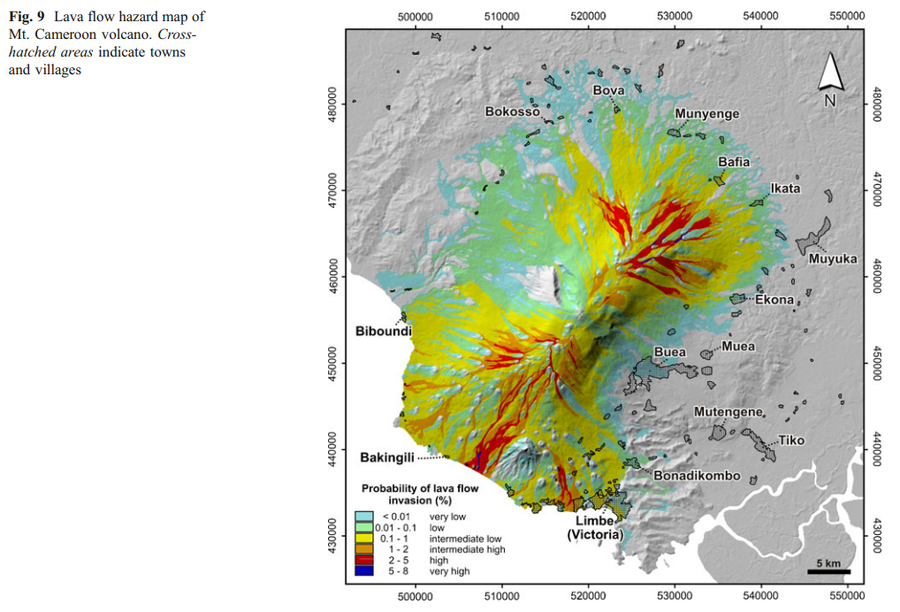
Figure in a journal article
Lava flow hazard map of Mt. Cameroon volcano
Figure 9 in: Favalli, M., Tarquini, S., Papale, P., Fornaciai, A., & Boschi, E. (2012). Lava flow hazard and risk at Mt. Cameroon volcano. Bulletin of Volcanology, 74(2), 423-439. https://doi.org/10.1007/s00445-011-0540-6
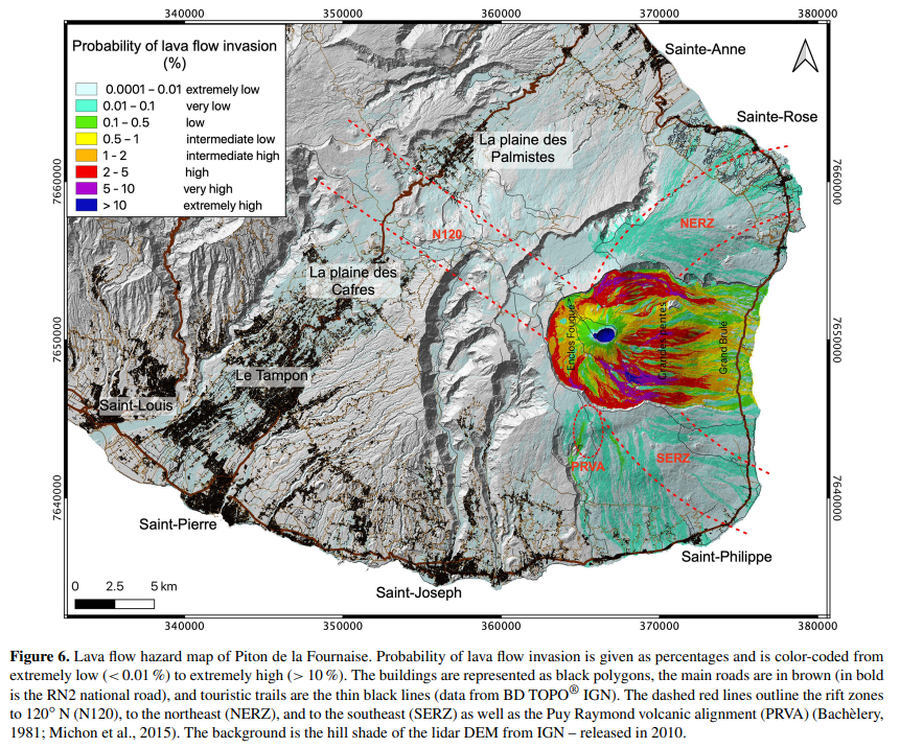
Figure in a journal article
Lava flow hazard map of Piton de la Fournaise
Figure 6 in: Chevrel, M. O., Favalli, M., Villeneuve, N., Harris, A. J., Fornaciai, A., Richter, N., Derrien, A., Di Muro, A., & Peltier, A. (2021). Lava flow hazard map of Piton de la Fournaise volcano. Natural Hazards and Earth System Sciences, 21(8), 2355-2377. https://doi.org/10.5194/nhess-21-2355-2021, 2021