
Advanced Search for Maps
Showing 61-70 of 131
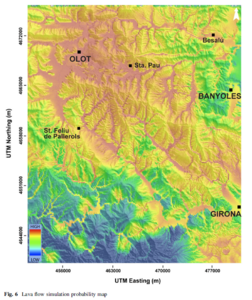
Figure in a journal article
Lava flow simulation probability map
Figure 6 in: Bartolini, S., Bolós, X., Martí, J., Pedra, E. R., & Planagumà, L. (2015). Hazard assessment at the quaternary La Garrotxa volcanic field (NE Iberia). Natural Hazards, 78(2), 1349-1367. https://doi.org/10.1007/s11069-015-1774-y
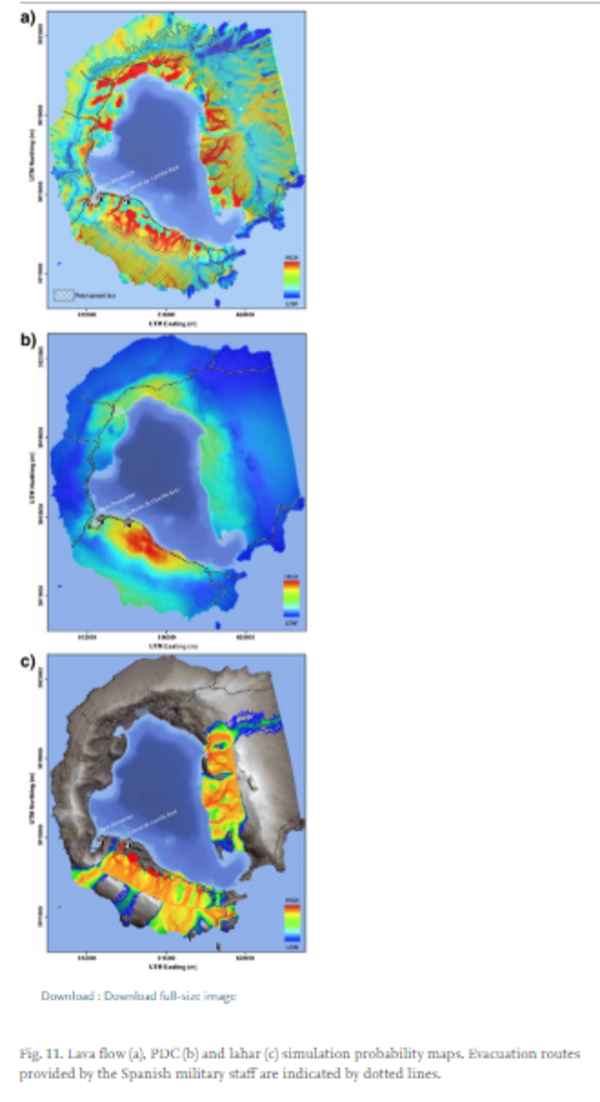
Figure in a journal article
Lava flow, PDC and lahar simulation probability maps.
Figure 11 in: Bartolini, S., Geyer, A., Martí, J., Pedrazzi, D., & Aguirre-Díaz, G. (2014). Volcanic hazard on Deception Island (South Shetland Islands, Antarctica). Journal of Volcanology and Geothermal Research, 285, p. 150-168. https://doi.org/10.1016/j.jvolgeores.2014.08.009
Official, Figure in hazard assessment
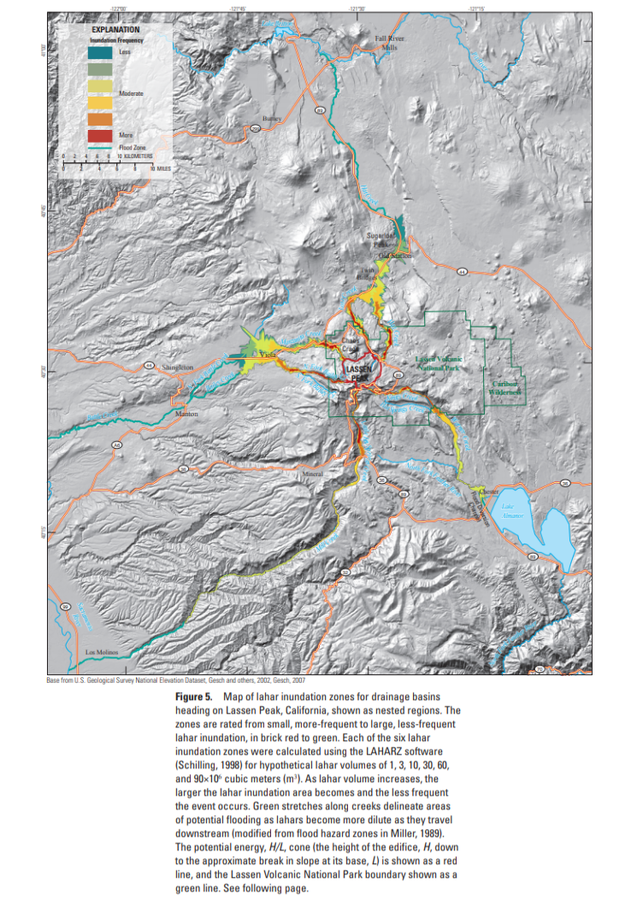
Map of lahar inundation zones for drainage basins
Figure 5 in: Robinson, J. E. & Clynne, M. A. (2012). Lahar Hazard Zones for Eruption-Generated Lahars in the Lassen Volcanic Center, California. U.S. Geological Survey Scientific Investigations Report , 2012-5176-C, 13 p. https://doi.org/10.3133/sir20125176C
Official, Figure in a journal article
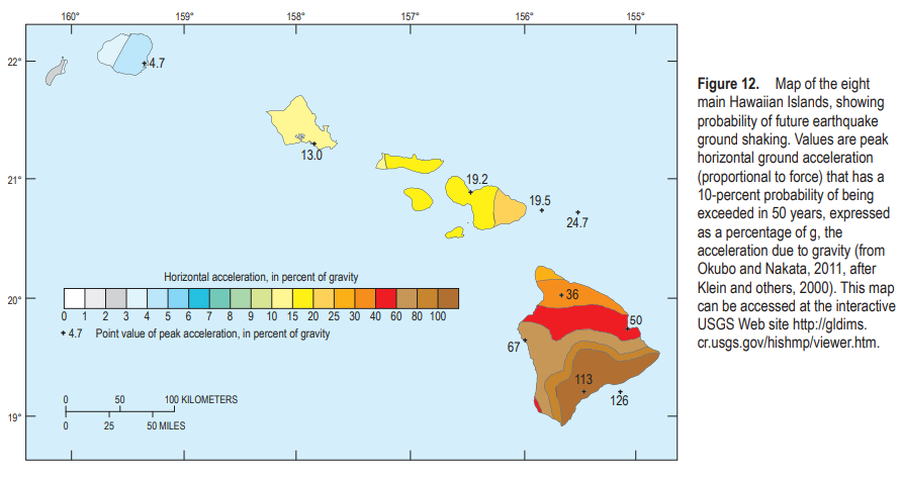
Map of the eight main Hawaiian Islands, showing probability of future earthquake ground shaking
Figure 12 in: Kauahikaua, J.P. & Tilling, R.I. (2014). Natural hazards and risk reduction in Hawai‘i. In: Poland, M.P., Takahashi, T.J., & Landowski, C.M. (eds.) Characteristics of Hawaiian Volcanoes. US Geological Survey Professional Paper 1801, p. 397-427. https://doi.org/10.3133/pp180110
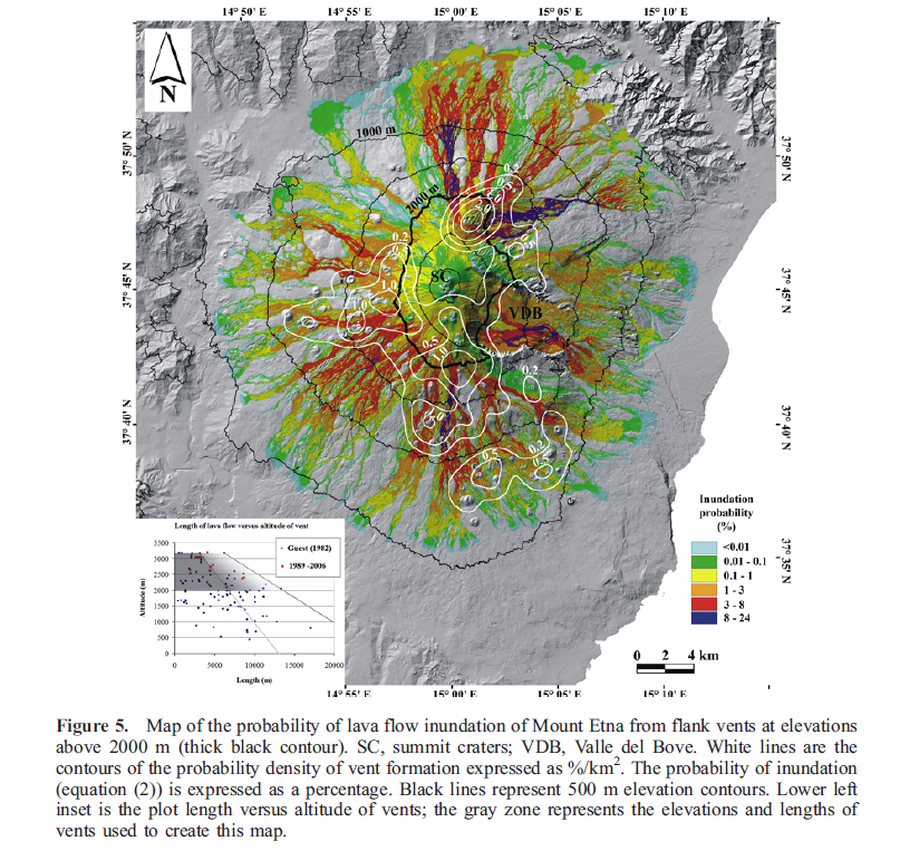
Figure in a journal article
Map of the probability of lava flow inundation of Mount Etna from flank vents at elevations above 2000 m
Figure 5 in: Favalli, M., Mazzarini, F., Pareschi, M. T., & Boschi, E. (2009). Topographic control on lava flow paths at Mount Etna, Italy: implications for hazard assessment. Journal of Geophysical Research: Earth Surface, 114(F1). https://doi.org/10.1029/2007JF000918

Figure in a journal article
Map of the probability of lava flow inundation of Mount Etna from flank vents at elevations above 2000 m calculated assuming a uniform probability of vent opening.
Figure 7 in: Favalli, M., Mazzarini, F., Pareschi, M. T., & Boschi, E. (2009). Topographic control on lava flow paths at Mount Etna, Italy: implications for hazard assessment. Journal of Geophysical Research: Earth Surface, 114(F1). https://doi.org/10.1029/2007JF000918
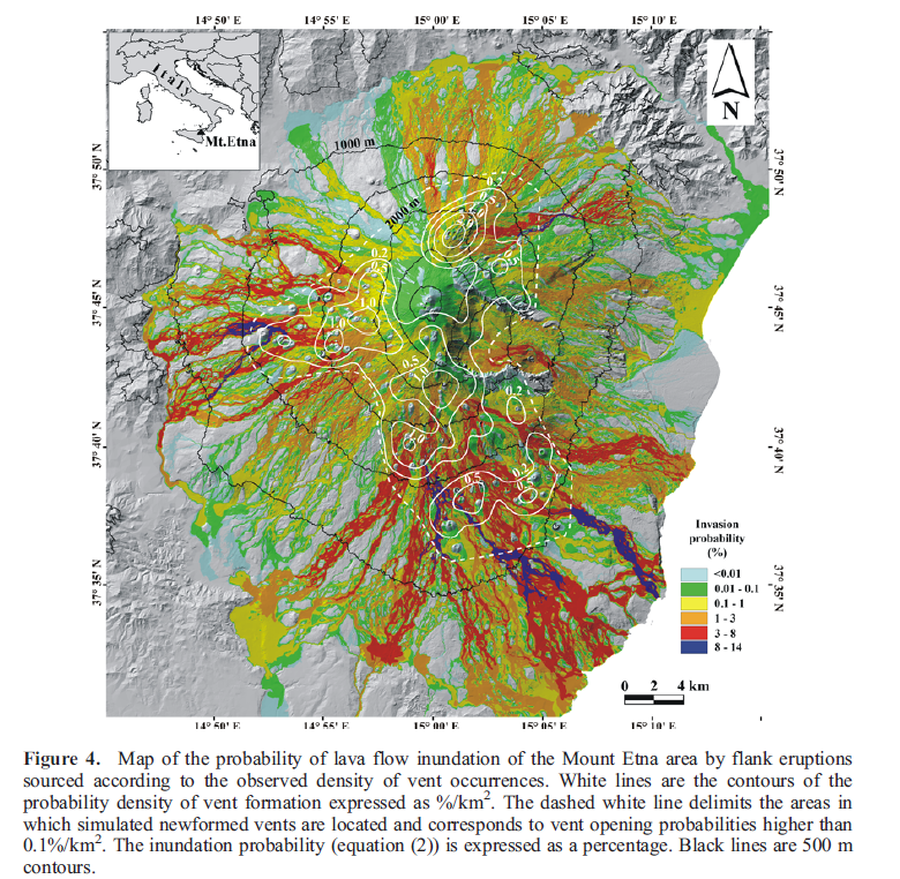
Figure in a journal article
Map of the probability of lava flow inundation of the Mount Etna area by flank eruptions sourced according to the observed density of vent occurrences
Figure 4 in: Favalli, M., Mazzarini, F., Pareschi, M. T., & Boschi, E. (2009). Topographic control on lava flow paths at Mount Etna, Italy: implications for hazard assessment. Journal of Geophysical Research: Earth Surface, 114(F1). https://doi.org/10.1029/2007JF000918
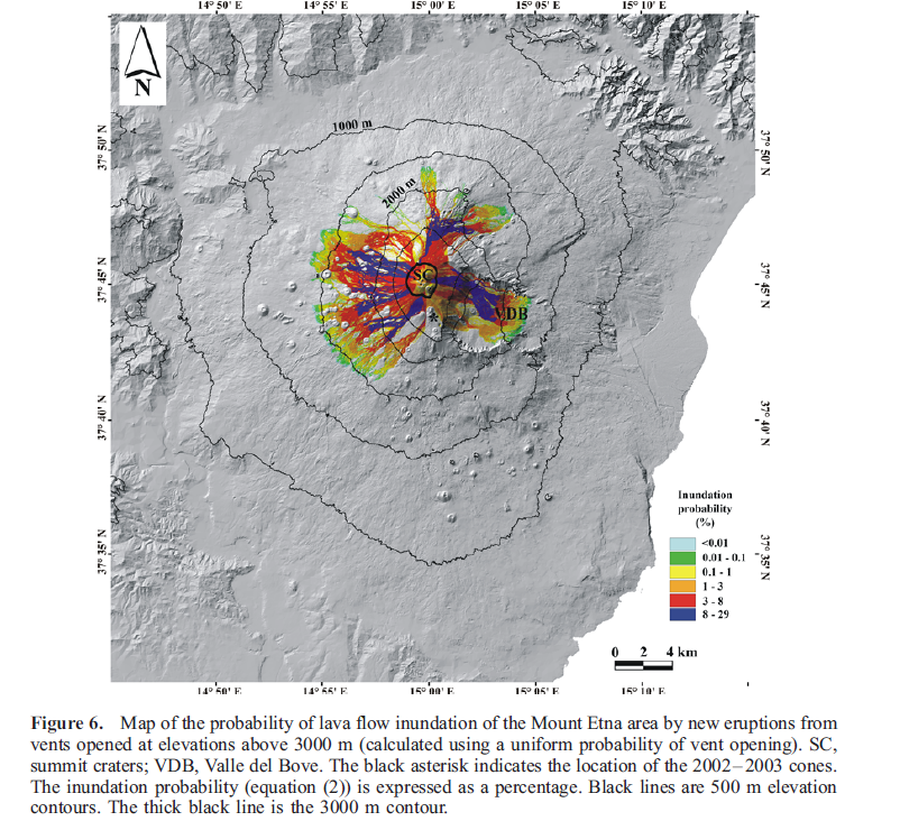
Figure in a journal article
Map of the probability of lava flow inundation of the Mount Etna area by new eruptions from vents opened at elevations above 3000 m (calculated using a uniform probability of vent opening)
Figure 6 in: Favalli, M., Mazzarini, F., Pareschi, M. T., & Boschi, E. (2009). Topographic control on lava flow paths at Mount Etna, Italy: implications for hazard assessment. Journal of Geophysical Research: Earth Surface, 114(F1). https://doi.org/10.1029/2007JF000918
Official, Figure in hazard assessment
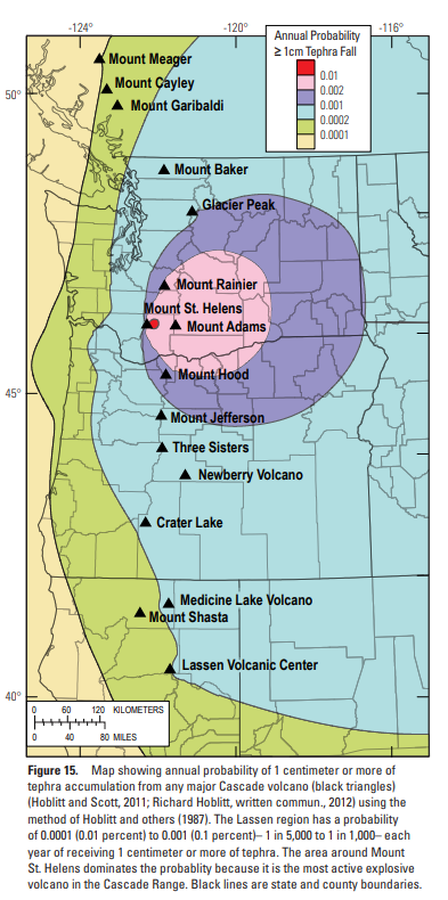
Map showing annual probability of 1 centimeter or more of tephra accumulation from any major Cascade volcano
Figure 15 in: Clynne, M. A., Robinson, J. E., Nathenson, M. & Muffler, L. P. (2012). Volcano hazards assessment for the Lassen region, northern California. U.S. Geological Survey, Scientific Investigations Report 2012-5176-A, 47 p., 1 plate. https://doi.org/10.3133/sir20125176A
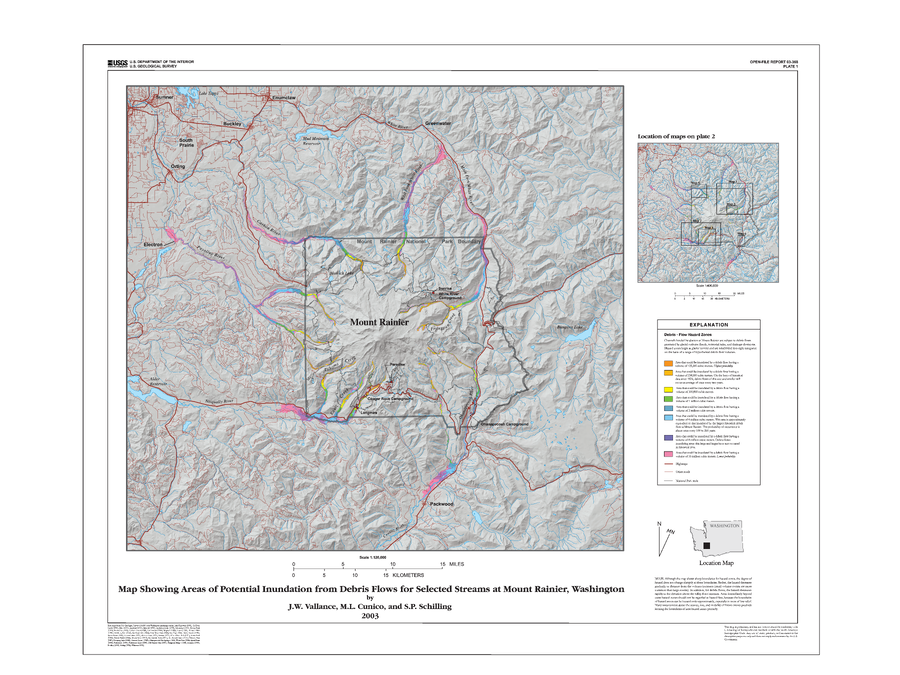
Official, Insert/poster-size map with accompanying report
Map Showing Areas of Potential Inundation from Debris Flows for Selected Streams at Mount Rainier, Washington
Plate 1 in: Vallance, J.W., Cunico, M.L. & Schilling, S.P. (2003). Debris-flow hazards caused by hydrologic events at Mount Rainier, Washington. U.S. Geological Survey, Open-File Report 03-368, 4 p., 2 plates. https://doi.org/10.3133/ofr03368