
Advanced Search for Maps
Showing 61-70 of 508
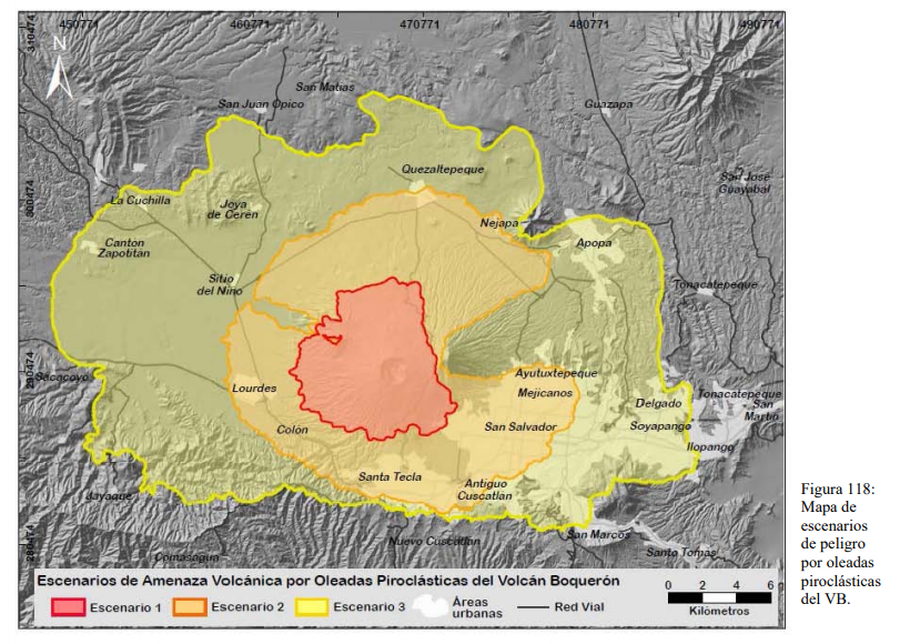
Figure in a thesis or dissertation
Escenarios de Amenaza por Oleadas Piroclásticas del Volcán Boquerón
(Threat Scenarios due to Pyroclastic Surges from the Boquerón Volcano)
Figure 118 in: Ferrés López, M.D. (2014). Estratigrafía, Geología y Evaluación de Peligros Volcánicos del Complejo Volcánico de San Salvador (El Salvador). Doctoral Thesis, Universidad Autónoma de México, México.
Official, Figure in hazard assessment
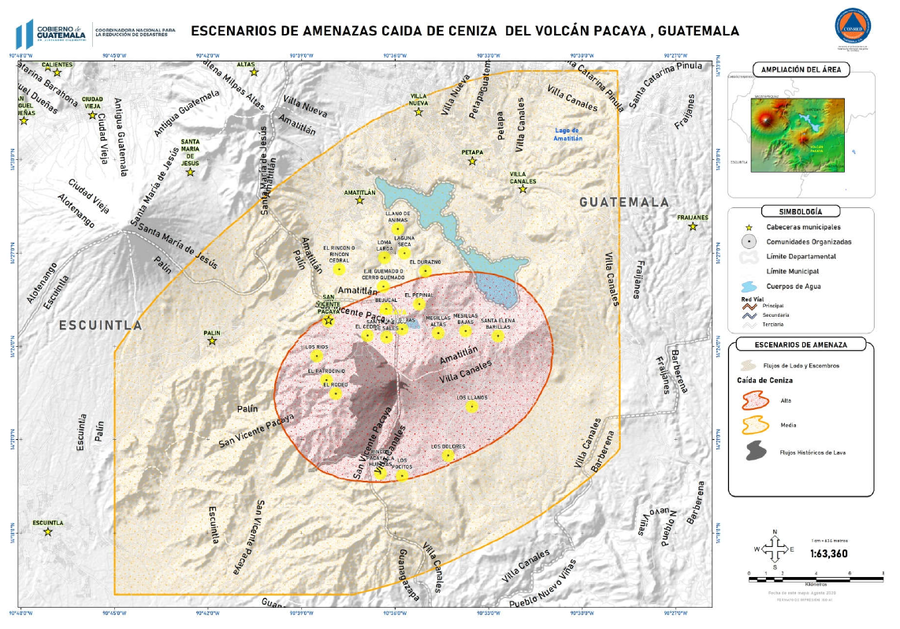
Escenarios de amenazas caída de ceniza del Volcán Pacaya, Guatemala
(Hazard scenarios of ash fall from the Pacaya Volcano, Guatemala)
3.2.2 in: Coordinadora Nacional para la Reducción de Desastres (CONRED). (2021). Protocolo Operativo por Actividad Efusiva del Volcán Pacaya. https://conred.gob.gt/documentos/planes/DRE_20210211_01_PROTOCOLO_OPERATIVO_POR_ACTIVIDAD_EFUSIVA_VOLCAN_PACAYA.pdf
Official, Figure in hazard assessment
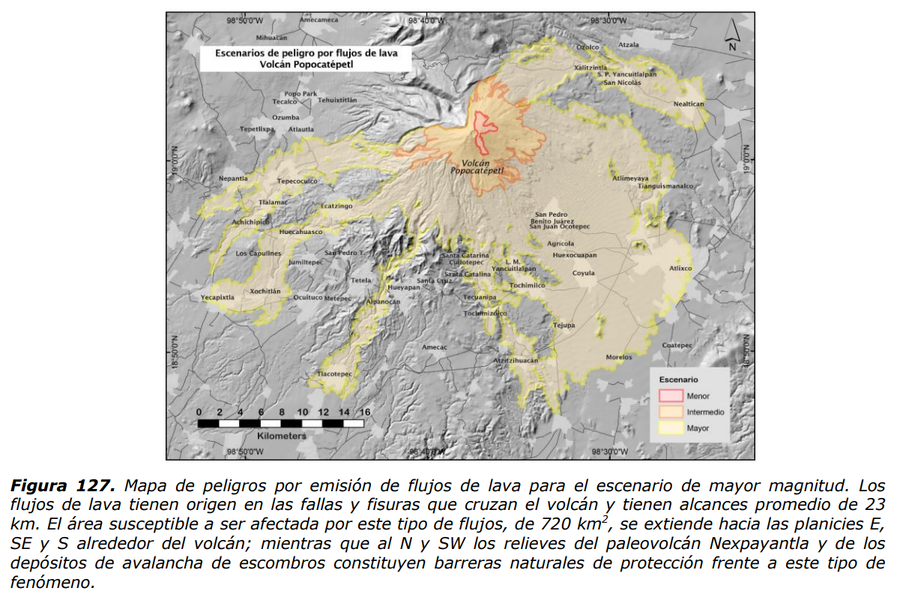
Escenarios de peligro por flujos de lava Volcán Popocatépetl
(Hazard scenarios due to lava flows Popocatépetl Volcano)
Figure 127 in: Martin Del Pozzo, A.L, Alatorre Ibargüengoitia M., Arana Salinas L., Bonasia R., Capra Pedol L., Cassata W., Cordoba G., Cortés Ramos J., Delgado Granados H., Ferrés López M.D., Fonseca Álvarez R., García Reynoso J.A., Gisbert G., Guerrero López D.A., Jaimes Viera M., Macías Vázquez J.L., Nieto Obregon J., Nieto Torres A., Paredes Ruiz P.A., Portocarrero Martínez J., Renne P., Rodríguez Espinosa D.M., Salinas Sánchez S., Siebe Grabach C., & Tellez Ugalde E. (2017). Estudios geológicos y actualización del mapa de peligros del volcán Popocatépetl. Memoria técnica del mapa de peligros del volcán Popocatépetl. Instituto de Geofísica, Universidad Nacional Autónoma de México (UNAM).
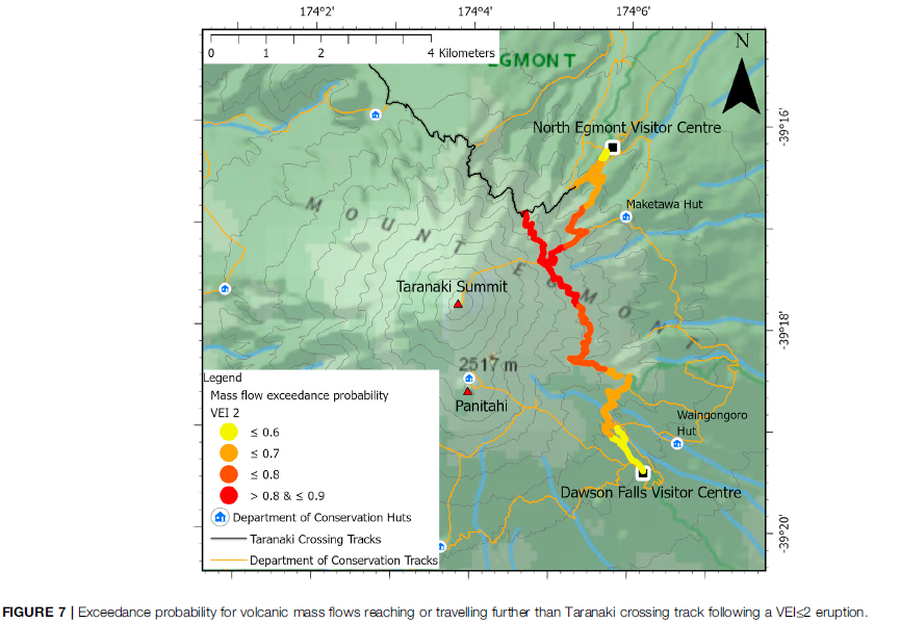
Figure in a journal article
Exceedance probability for volcanic mass flows reaching or travelling further than Taranaki crossing track following a VEI≤2 eruption
Figure 7 in: Mead, S., Procter, J., Bebbington, M., & Rodriguez-Gomez, C. (2022). Probabilistic Volcanic Hazard Assessment for National Park Infrastructure Proximal to Taranaki Volcano (New Zealand). Frontiers in Earth Science, 435. https://doi.org/10.3389/feart.2022.832531
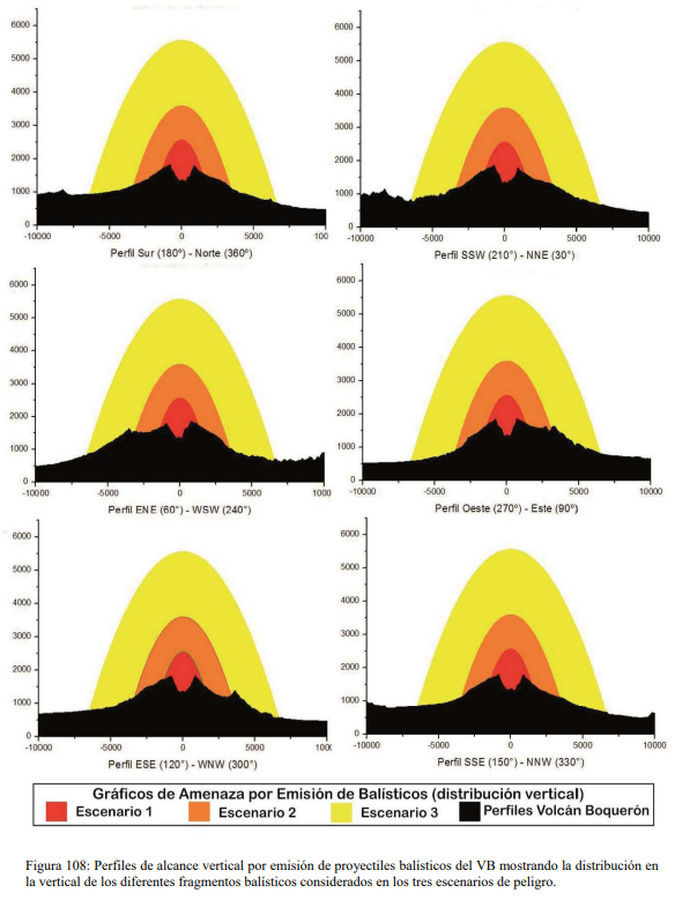
Figure in a thesis or dissertation
Gráficos de Amenaza por Emisión de Balísticos (distribución vertical)
(Ballistic Emission Threat Charts (vertical distribution))
Figure 108 in: Ferrés López, M.D. (2014). Estratigrafía, Geología y Evaluación de Peligros Volcánicos del Complejo Volcánico de San Salvador (El Salvador). Doctoral Thesis, Universidad Autónoma de México, México.
Guntur, Indonesia
Official, Map sheet or poster
Guntur Volcanic Hazard Map
Purbawinata, M.A. & Wirakusumah, A.D. (2003). Crisis preparedness of the people of Tarogong-Garut, a small town on the foot of Guntur Volcano West Java-Indonesia. Directorate of Volcanology and Geological Hazard Mitigation (DVGHM), Directorate General of Geology and Mineral Resources (DGGMR), Ministry of Energy and Mineral Resources (MEMR). UN Early Warning Conference II, Bonn.
Official, Figure on website
Hakone-machi volcanic disaster prevention map whole area
Hakone-machi Town. (2004). Entire volcano disaster prevention map. Hakone Volcano Disaster Prevention Map. https://www.town.hakone.kanagawa.jp/index.cfm/10,1218,46,167,html

Official, Figure on website
Hazard Level: 1
Montserrat Volcano Observatory (MVO). (Year Unknown). Hazard Level. Retrieved 29 March, 2022, from http://www.mvo.ms/
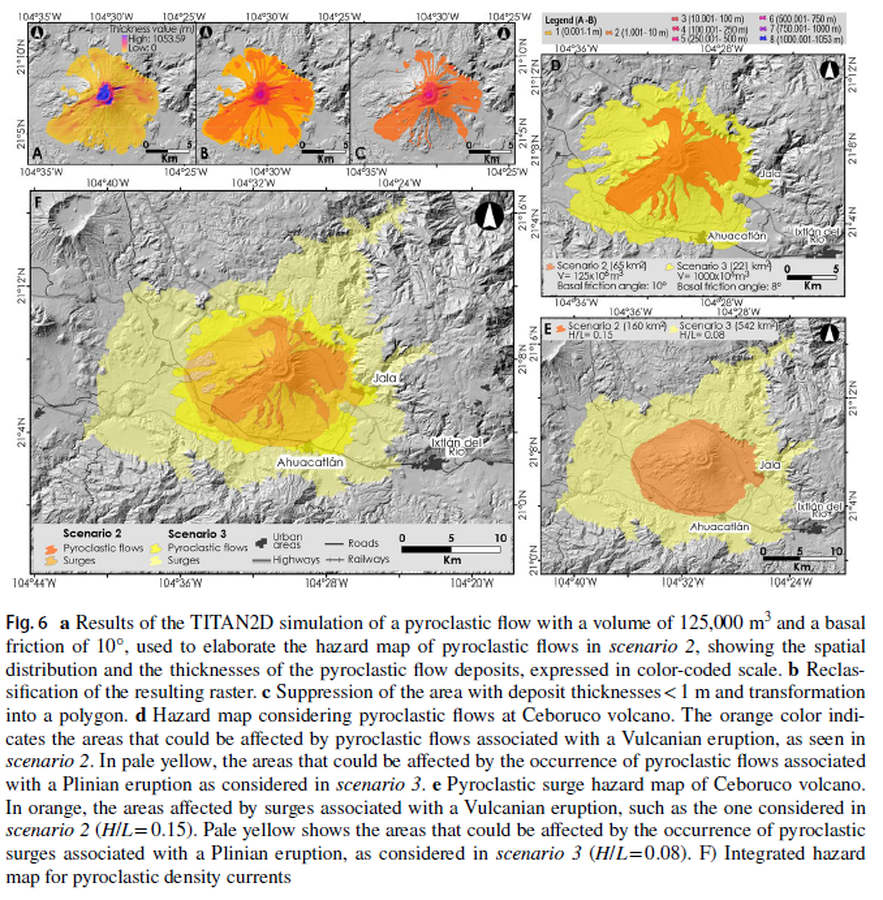
Figure in a journal article
Hazard map considering pyroclastic flows at Ceboruco volcano
Figure 6 in: Sieron, K., Ferrés, D., Siebe, C., Constantinescu, R., Capra, L., Connor, C., Connor, L., Groppelli, G. & Zuccolotto, K.G. (2019). Ceboruco hazard map: part II—modeling volcanic phenomena and construction of the general hazard map. Natural Hazards, 96(2), p. 893-933. https://doi.org/10.1007/s11069-019-03577-5
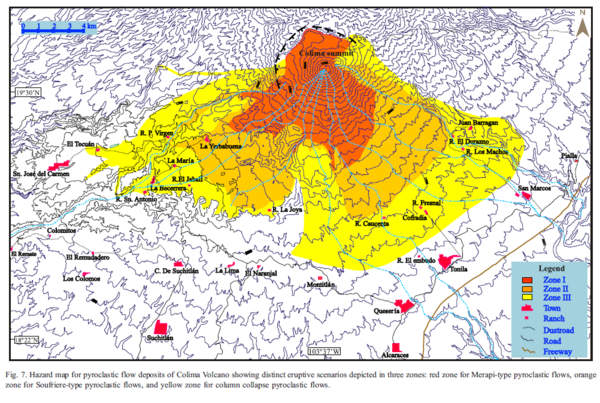
Figure in a journal article
Hazard map for pyroclastic flow deposits of Colima Volcano showing distinct eruptive scenarios depicted in three zones.
Figure 7 in: Saucedo, R., Macías, J.L., Sheridan, M.F., Bursik, M.I., & Komorowski, J.-C. (2005). Modeling of pyroclastic flows of Colima Volcano, Mexico: implications for hazard assessment. Journal of Volcanology and Geothermal Research, 139(1-2), p. 103-115. https://doi.org/10.1016/j.jvolgeores.2004.06.019