
Advanced Search for Maps
Showing 31-39 of 39
Official, Figure in hazard assessment
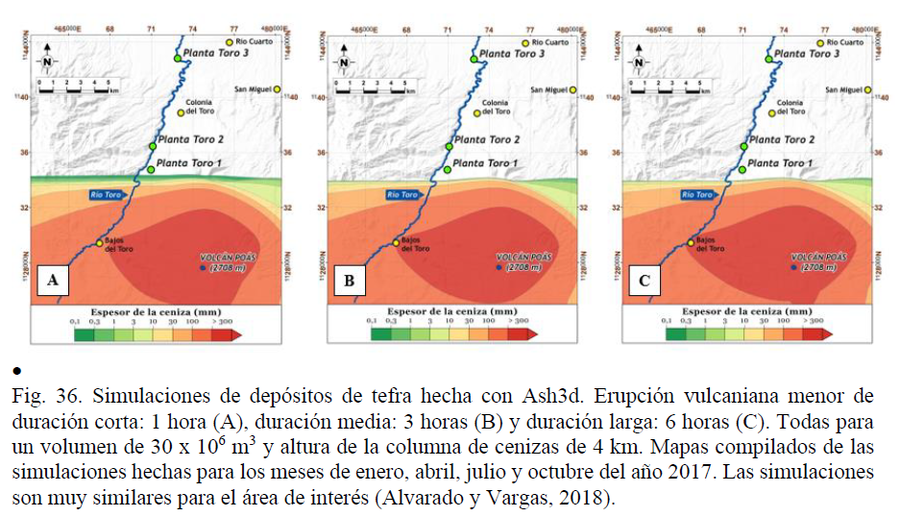
Simulaciones de depósitos de tefra hecha con Ash3d.
(Simulations of tephra deposits made with Ash3d.)
Alvarado, G.E. & Vargas, A. (2018). Plantas Hidroeléctricas Toro 1, 2 y 3: Actualización de la amenaza volcánica del Poás. 120 p. Área de Amenazas y Auscultación Sismológica y Volcánica, ICE [Inf. Interno]. Reprinted in: Alvarado, G.E., Esquivel, L., Sánchez, B.E., & Alfaro, J.C. (2020). Actualización del Peligro Volcánico del Poás, Costa Rica. Comisión Nacional de Prevención de Riesgos y Atención de Emergencias (CNE). Febrero 2020.
Official, Figure in a journal article
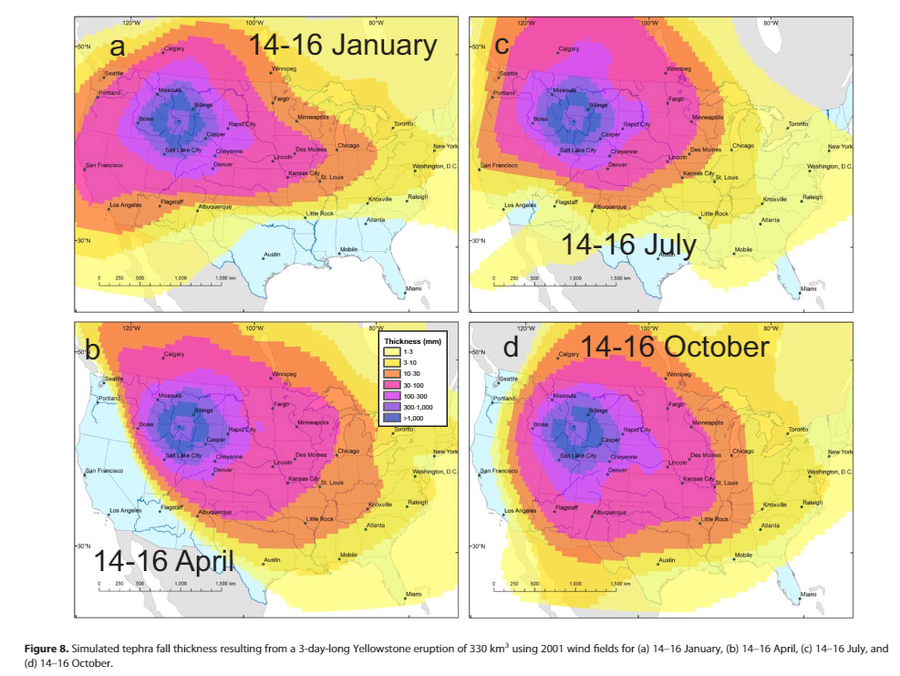
Simulated tephra fall thickness resulting from a 3-day-long Yellowstone eruption of 330 km³ using 2001 wind fields for (a) 14–16 January, (b) 14–16 April, (c) 14–16 July, and(d) 14–16 October.
Figure 8 in: Mastin, L.G., Van Eaton, A.R., & Lowenstern, J.B. (2014). Modeling ash fall distribution from a Yellowstone supereruption. Geochemistry, Geophysics, Geosystems, 15(8), 3459-3475. https://doi.org/10.1002/2014GC005469
Official, Figure in a journal article
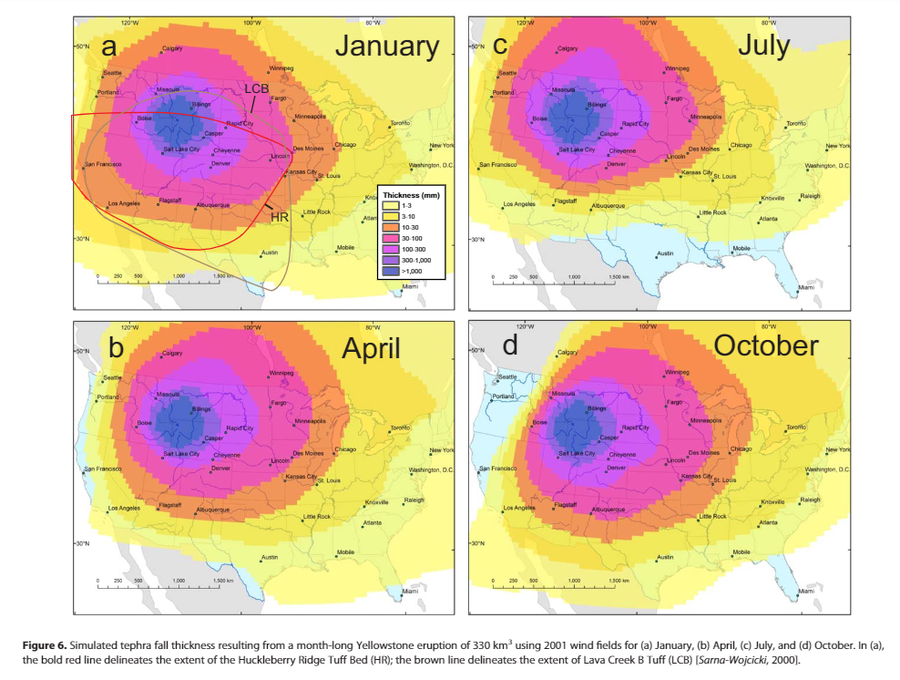
Simulated tephra fall thickness resulting from a month-long Yellowstone eruption of 330 km³ using 2001 wind fields for (a) January, (b) April, (c) July, and (d) October.
Figure 6 in: Mastin, L.G., Van Eaton, A.R., & Lowenstern, J.B. (2014). Modeling ash fall distribution from a Yellowstone supereruption. Geochemistry, Geophysics, Geosystems, 15(8), 3459-3475. https://doi.org/10.1002/2014GC005469
Official, Figure in a journal article
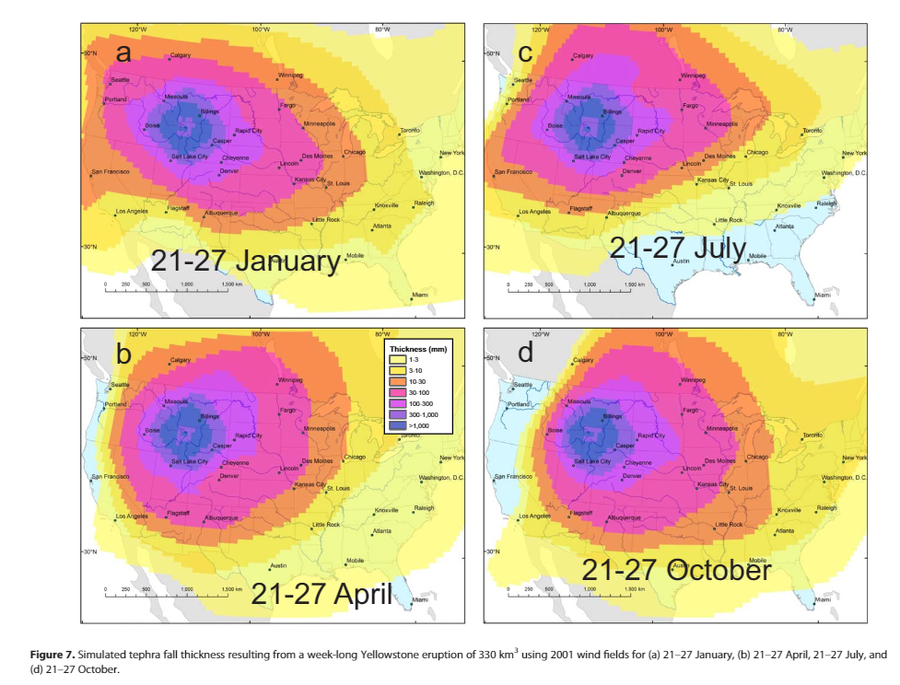
Simulated tephra fall thickness resulting from a week-long Yellowstone eruption of 330 km³ using 2001 wind fields for (a) 21–27 January, (b) 21–27 April, 21–27 July, and(d) 21–27 October.
Figure 7 in: Mastin, L.G., Van Eaton, A.R., & Lowenstern, J.B. (2014). Modeling ash fall distribution from a Yellowstone supereruption. Geochemistry, Geophysics, Geosystems, 15(8), 3459-3475. https://doi.org/10.1002/2014GC005469
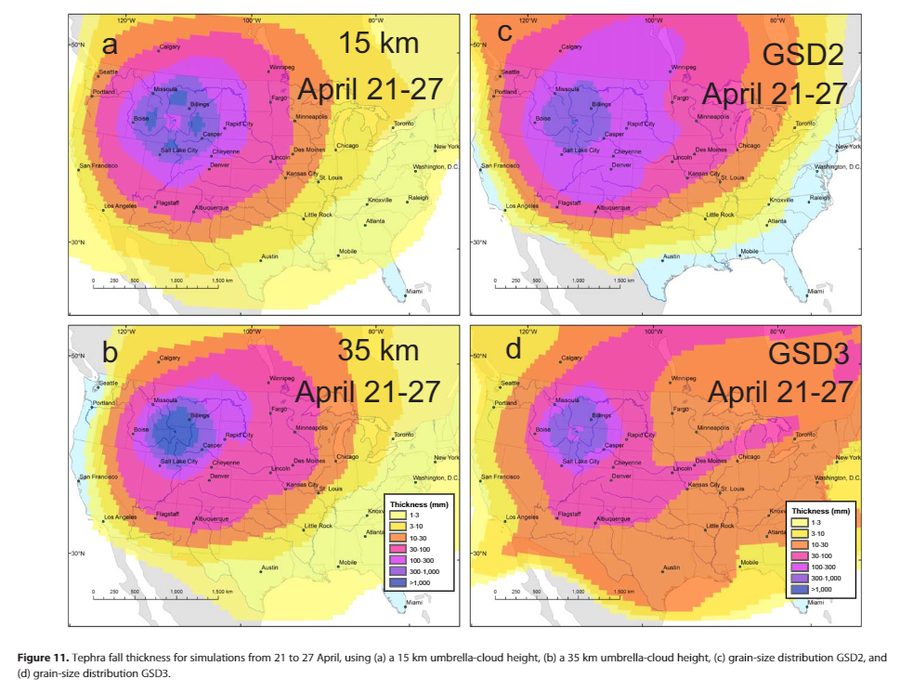
Official, Figure in a journal article
Tephra fall thickness for simulations from 21 to 27 April, using (a) a 15 km umbrella-cloud height, (b) a 35 km umbrella-cloud height, (c) grain-size distribution GSD2, and(d) grain-size distribution GSD3.
Figure 11 in: Mastin, L.G., Van Eaton, A.R., & Lowenstern, J.B. (2014). Modeling ash fall distribution from a Yellowstone supereruption. Geochemistry, Geophysics, Geosystems, 15(8), 3459-3475. https://doi.org/10.1002/2014GC005469
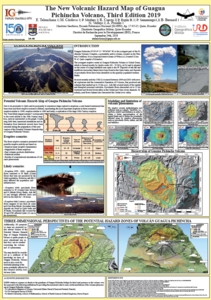
Official, Figure in a conference presentation
The New Volcanic Hazard Map of Guagua Pichincha Volcano, Third Edition 2019
Telenchana, E., Córdova, M., Mothes, P., Espín, P., Samaniego, P., Bernard, B., Vallejo, S., & Proaño A. (2019). The new potential volcanic hazard map of Guagua Pichincha Volcano, Third Edition 2019. 8th International Symposium on Andean Geodynamics (ISAG).
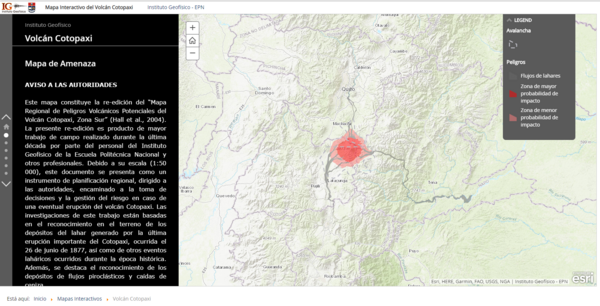
Official, Interactive web-based map
Volcán Cotopaxi Mapa de Amenaza
(Cotopaxi Volcano Hazard Map)
Instituto Geofísico de la Escuela Politecnica Nacional (IG-EPN). (2019). Volcán Cotopaxi Mapa de Amenaza. Instituto Geofísico de la Escuela Politecnica Nacional, Mapa Interactivo del Volcán Cotopaxi. https://www.igepn.edu.ec/cotopaxi
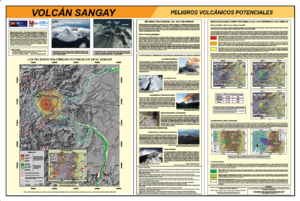
Official, Map sheet or poster
Volcán Sangay, Peligros Volcánicos Potenciales
(Sangay Volcano, Potential Volcanic Hazards)
Ordóñez, J., Vallejo, S., Bustillos, J., Hall, M., Andrade, D., Hidalgo, S., & Samaniego, P. (2013). Volcán Sangay, Peligros Volcánicos Potenciales. Instituto Geofisico de la Escuela Politecnica Nacional (IG-EPN) & Institut de Recherche pour le Développment (IRD). Quito.
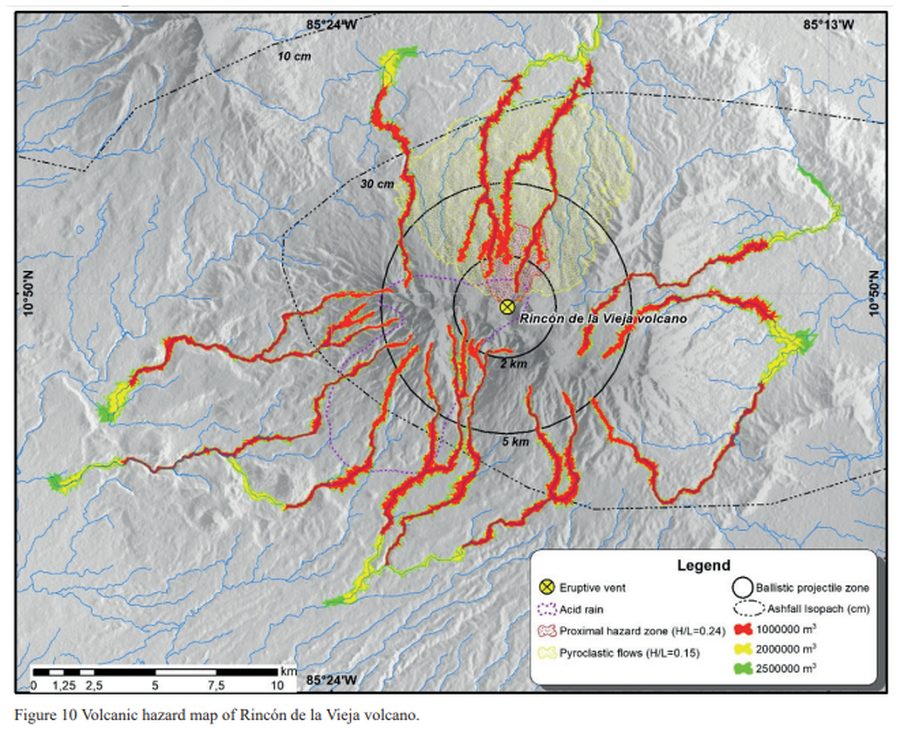
Figure in a journal article
Volcanic hazard map of Rincón de la Vieja volcano
Figure 10 in: Alpízar, Y., Fernández, M., Ramírez, C., & Arroyo, D. (2019). Hazard Map of Rincón de la Vieja Volcano, Costa Rica: Qualitative Integration of Computer Simulations and Geological Data. Anuario do Instituto de Geociencias, 42(3). http://dx.doi.org/10.11137/2019_3_474_488