
Advanced Search for Maps
Showing 11-18 of 18
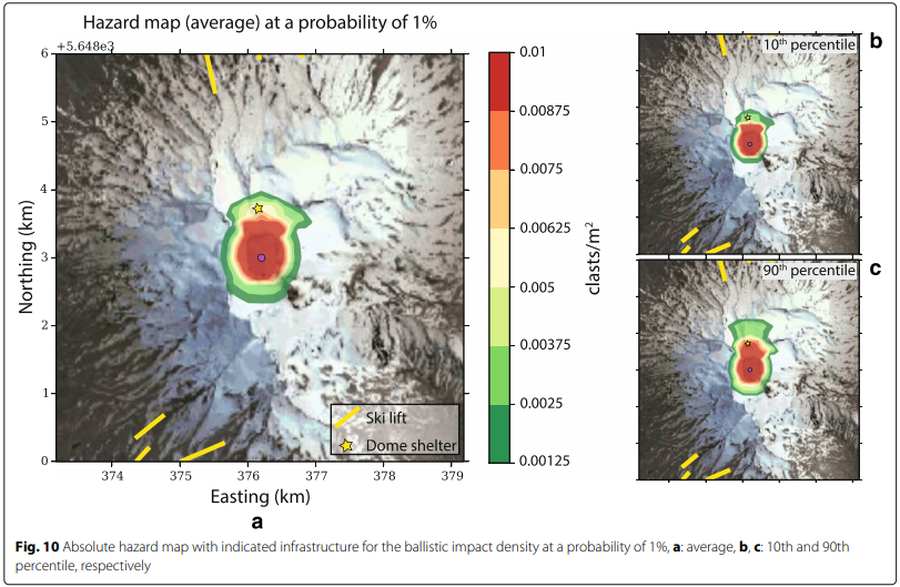
Figure in a journal article
Hazard map (average) at a probability of 1%
Figure 10 in: Strehlow, K., Sandri, L., Gottsmann, J. H., Kilgour, G., Rust, A. C., & Tonini, R. (2017). Phreatic eruptions at crater lakes: occurrence statistics and probabilistic hazard forecast. Journal of Applied Volcanology, 6(1), 4. https://doi.org/10.1186/s13617-016-0053-2
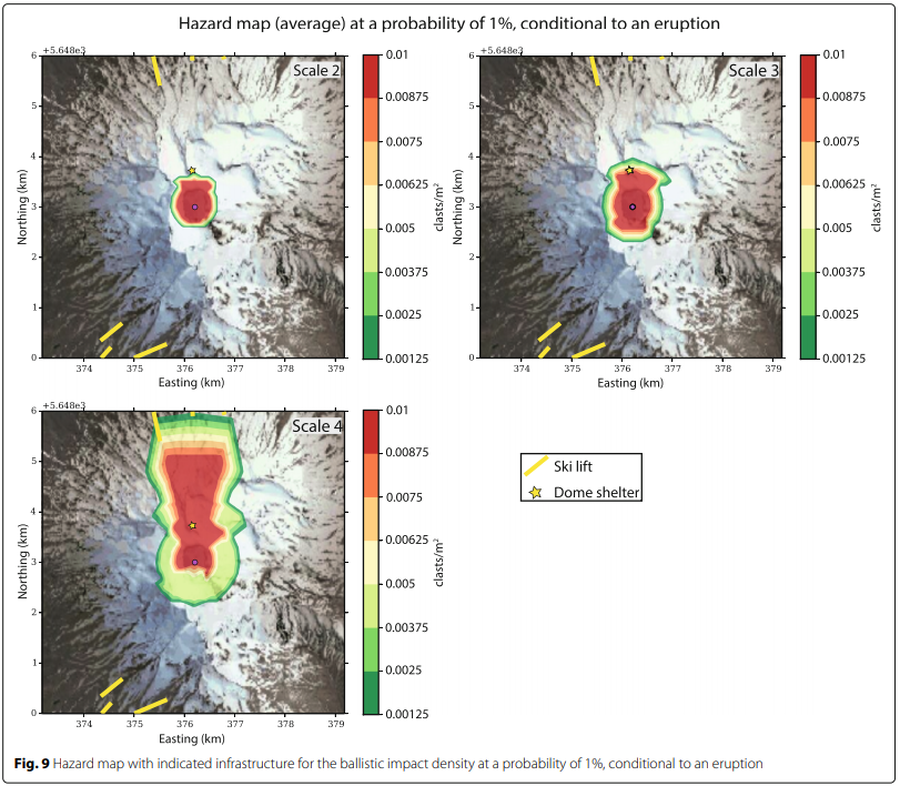
Figure in a journal article
Hazard map (average) at a probability of 1% conditional to an eruption
Figure 9 in: Strehlow, K., Sandri, L., Gottsmann, J. H., Kilgour, G., Rust, A. C., & Tonini, R. (2017). Phreatic eruptions at crater lakes: occurrence statistics and probabilistic hazard forecast. Journal of Applied Volcanology, 6(1), 4. https://doi.org/10.1186/s13617-016-0053-2
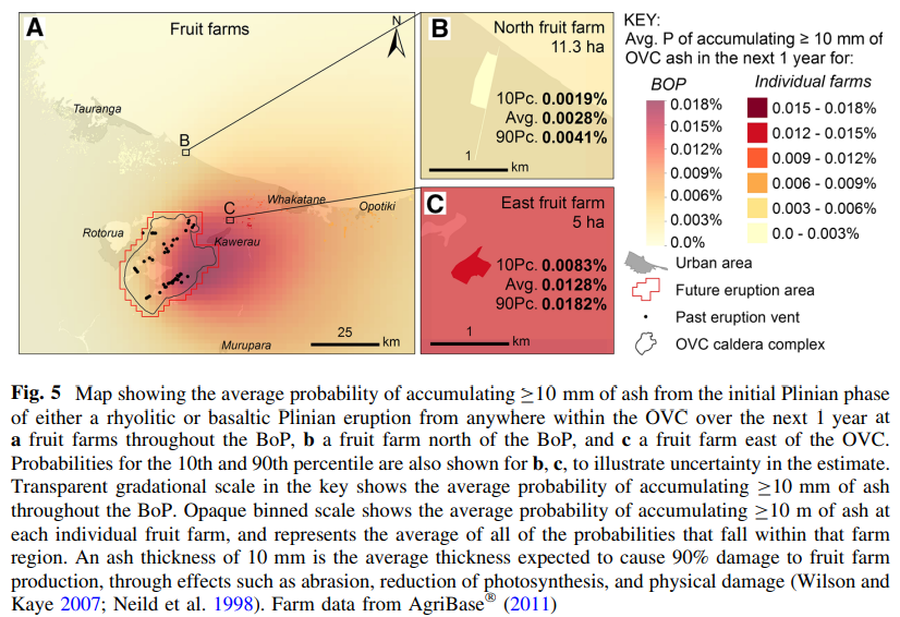
Figure in a journal article
Map showing the average probability of accumulating C10 mm of ash from the initial Plinian phase of either a rhyolitic or basaltic Plinian eruption from anywhere within the OVC over the next 1 year
Figure 5 in: Thompson, M. A., Lindsay, J. M., Wilson, T. M., Biass, S., & Sandri, L. (2017). Quantifying risk to agriculture from volcanic ashfall: a case study from the Bay of Plenty, New Zealand. Natural Hazards, 86(1), 31-56. https://doi.org/10.1007/s11069-016-2672-7
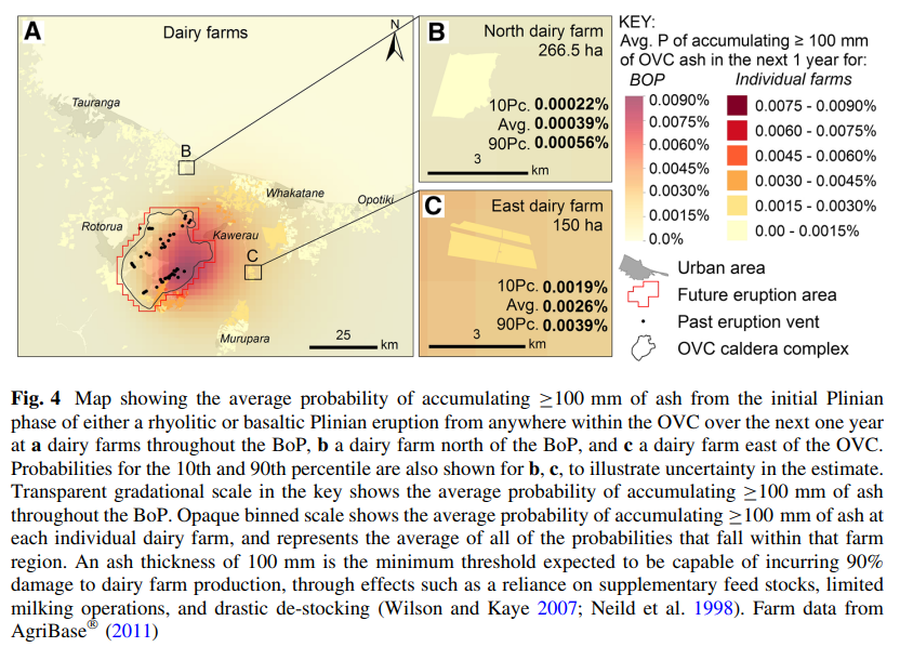
Figure in a journal article
Map showing the average probability of accumulating ≥100 mm of ash from the initial Plinian phase of either a rhyolitic or basaltic Plinian eruption from anywhere within the OVC over the next one year
Figure 4 in: Thompson, M. A., Lindsay, J. M., Wilson, T. M., Biass, S., & Sandri, L. (2017). Quantifying risk to agriculture from volcanic ashfall: a case study from the Bay of Plenty, New Zealand. Natural Hazards, 86(1), 31-56. https://doi.org/10.1007/s11069-016-2672-7
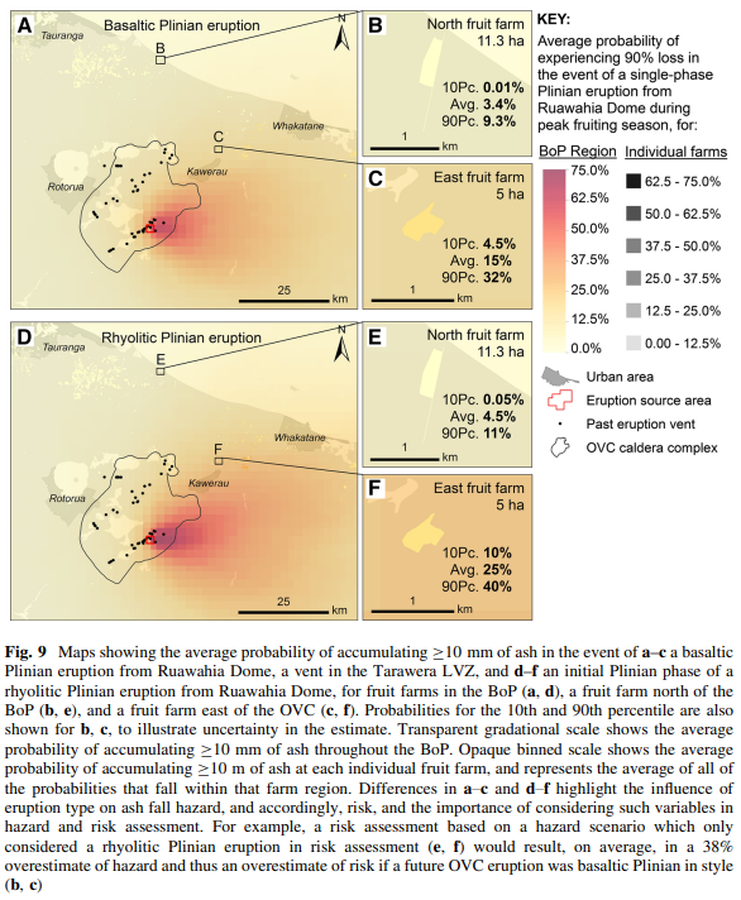
Figure in a journal article
Maps showing the average probability of accumulating ≥10 mm of ash in the event of a–c a basaltic Plinian eruption from Ruawahia Dome, a vent in the Tarawera LVZ, and d–f an initial Plinian phase of a rhyolitic Plinian eruption from Ruawahia Dome, for fruit farms in the BoP
Figure 9 in: Thompson, M. A., Lindsay, J. M., Wilson, T. M., Biass, S., & Sandri, L. (2017). Quantifying risk to agriculture from volcanic ashfall: a case study from the Bay of Plenty, New Zealand. Natural Hazards, 86(1), 31-56. https://doi.org/10.1007/s11069-016-2672-7
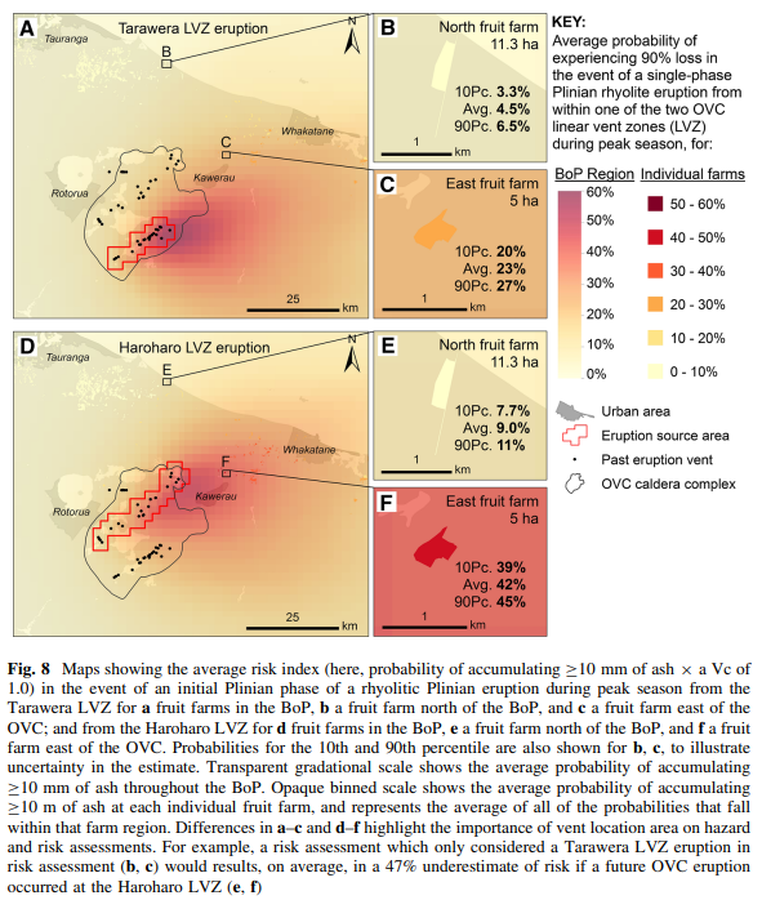
Figure in a journal article
Maps showing the average risk index (here, probability of accumulating ≥10 mm of ash × a Vc of 1.0) in the event of an initial Plinian phase of a rhyolitic Plinian eruption during peak season from the Tarawera LVZ for a fruit farms in the BoP
Figure 8 in: Thompson, M. A., Lindsay, J. M., Wilson, T. M., Biass, S., & Sandri, L. (2017). Quantifying risk to agriculture from volcanic ashfall: a case study from the Bay of Plenty, New Zealand. Natural Hazards, 86(1), 31-56. https://doi.org/10.1007/s11069-016-2672-7

Figure in a journal article
Probability for areas to experience a ballistic impact density >0.01, conditional to an eruption
Figure 11 in: Strehlow, K., Sandri, L., Gottsmann, J. H., Kilgour, G., Rust, A. C., & Tonini, R. (2017). Phreatic eruptions at crater lakes: occurrence statistics and probabilistic hazard forecast. Journal of Applied Volcanology, 6(1), 4. https://doi.org/10.1186/s13617-016-0053-2
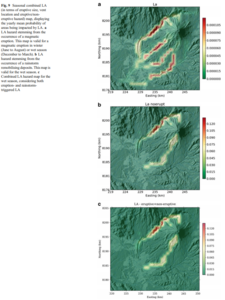
Figure in a journal article
Seasonal combined LA (in terms of eruptive size, vent location and eruptive/noneruptive hazard) map, displaying the yearly mean probability of areas being impacted by LA
Figure 9 in: Sandri, L., Thouret, J. C., Constantinescu, R., Biass, S., & Tonini, R. (2014). Long-term multi-hazard assessment for El Misti volcano (Peru). Bulletin of volcanology, 76(2), 771. https://doi.org/10.1007/s00445-013-0771-9
Page: 1 2