
Advanced Search for Maps
Showing 21-30 of 39
Official, Insert/poster-size map with accompanying report
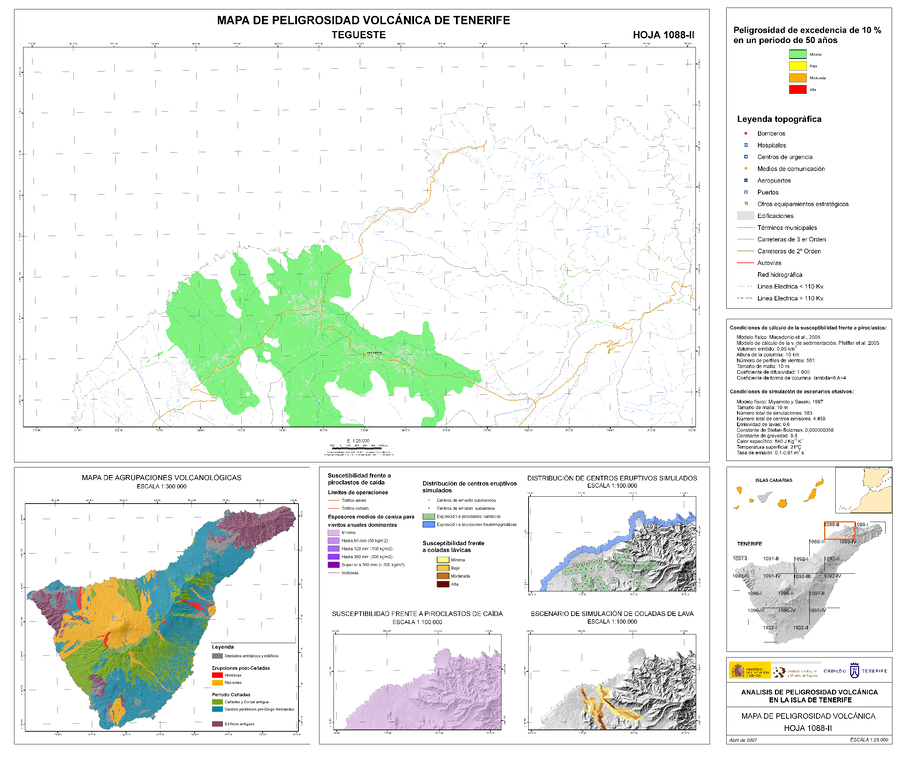
Analisis de Peligrosidad Volcánica en la Isla de Tenerife - Mapa de Peligrosidad Volcánica - Tegueste
(Volcanic Hazard Analysis on the Island of Tenerife - Volcanic Hazard Map - Tegueste)
Sheet 1088-II in: Instituto Geológico y Minero de España (IGME). (2006). Plan Territorial Especial de Ordenación para la Prevención de Riesgos. Documento Cartográfico (Planos de Información - Anexo Cartografía Peligrosidad Volcánica).
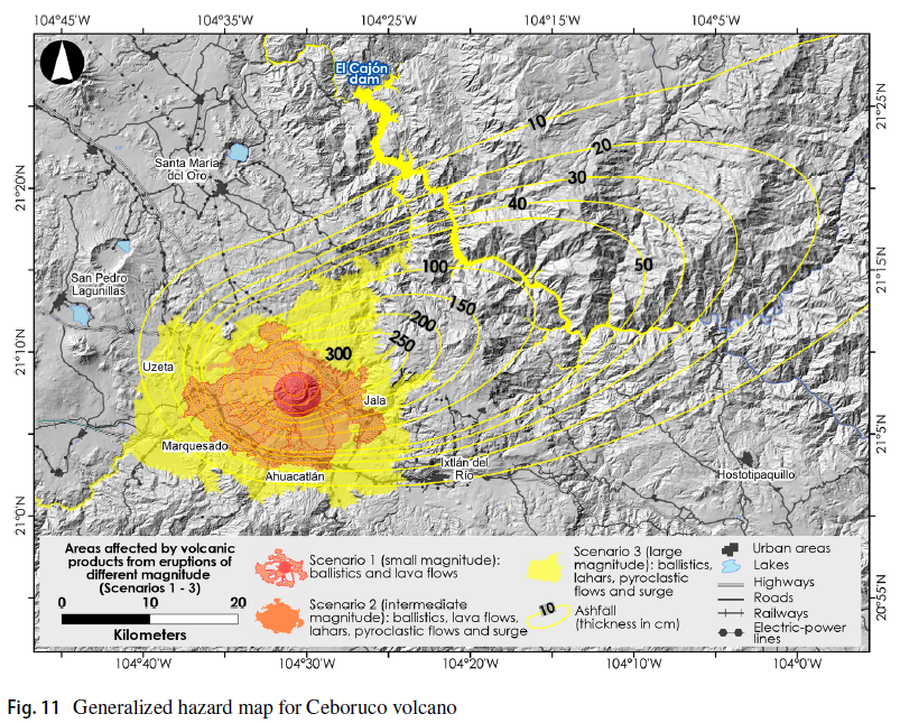
Figure in a journal article
Areas affected by volcanic products from eruptions of different magnitude (Scenarios 1-3)
Figure 11 in: Sieron, K., Ferrés, D., Siebe, C., Constantinescu, R., Capra, L., Connor, C., Connor, L., Groppelli, G. & Zuccolotto, K.G. (2019). Ceboruco hazard map: part II—modeling volcanic phenomena and construction of the general hazard map. Natural Hazards, 96(2), p. 893-933. https://doi.org/10.1007/s11069-019-03577-5
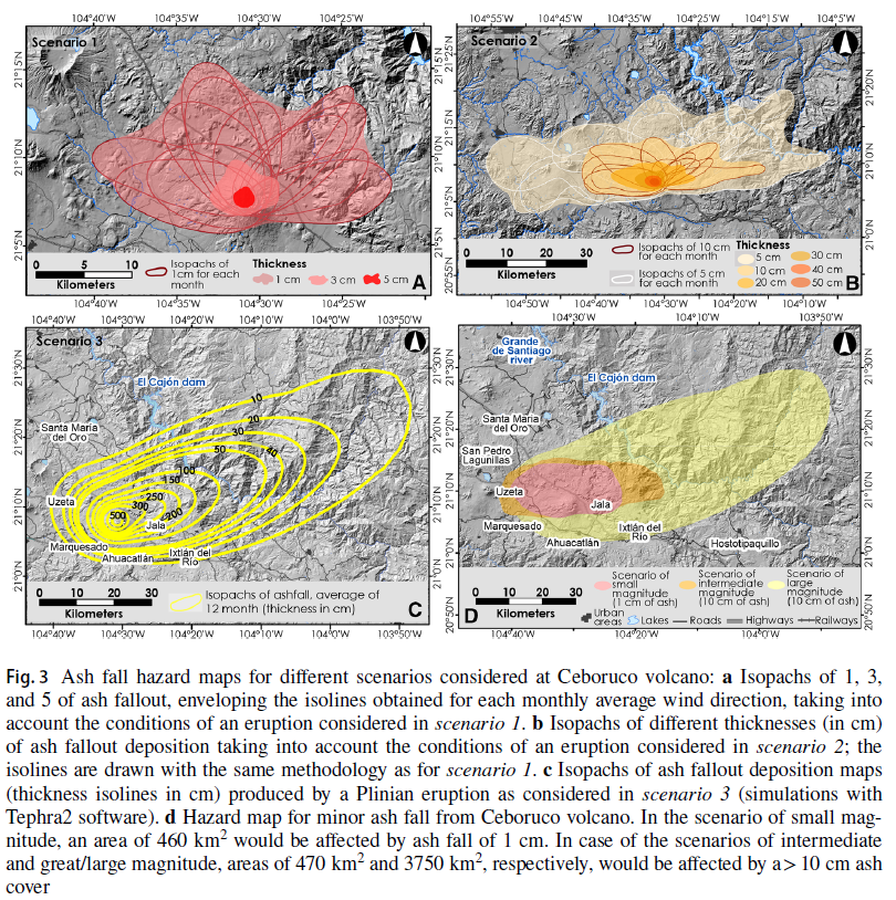
Figure in a journal article
Ash fall hazard maps for different scenarios considered at Ceboruco volcano
Figure 3 in: Sieron, K., Ferrés, D., Siebe, C., Constantinescu, R., Capra, L., Connor, C., Connor, L., Groppelli, G. & Zuccolotto, K.G. (2019). Ceboruco hazard map: part II—modeling volcanic phenomena and construction of the general hazard map. Natural Hazards, 96(2), p. 893-933. https://doi.org/10.1007/s11069-019-03577-5
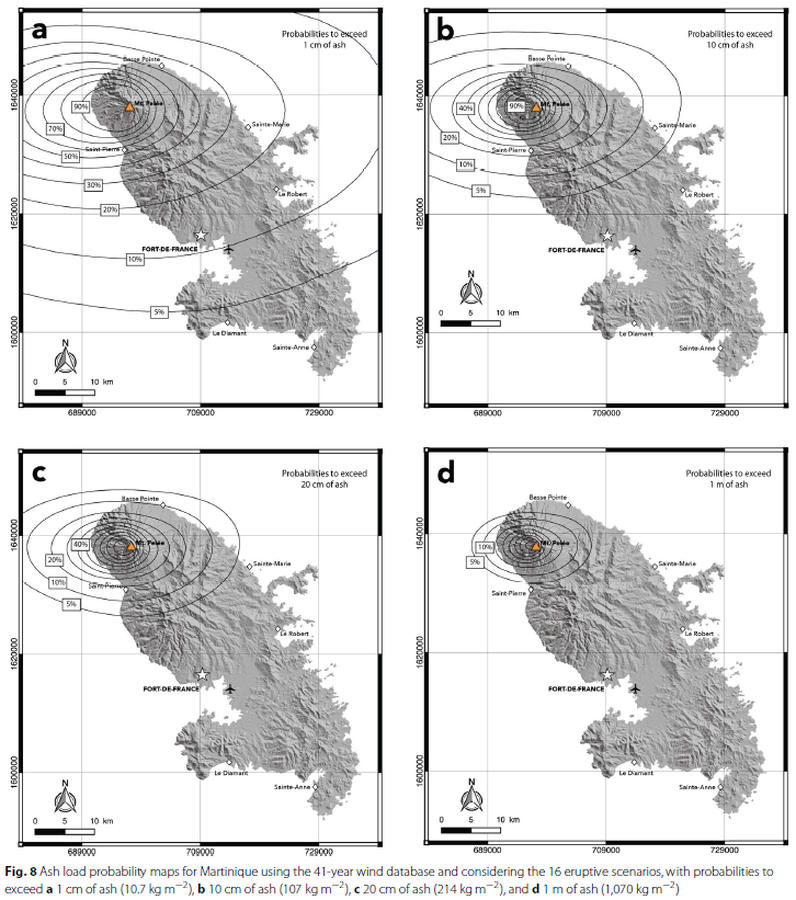
Figure in a journal article
Ash load probability maps for Martinique using the 41-year wind database and considering the 16 eruptive scenarios
Figure 8 in: Michaud-Dubuy, A., Carazzo, G., & Kaminski, E. (2021). Volcanic hazard assessment for tephra fallout in Martinique. Journal of Applied Volcanology, 10(1), 1-20. https://doi.org/10.1186/s13617-021-00106-7.
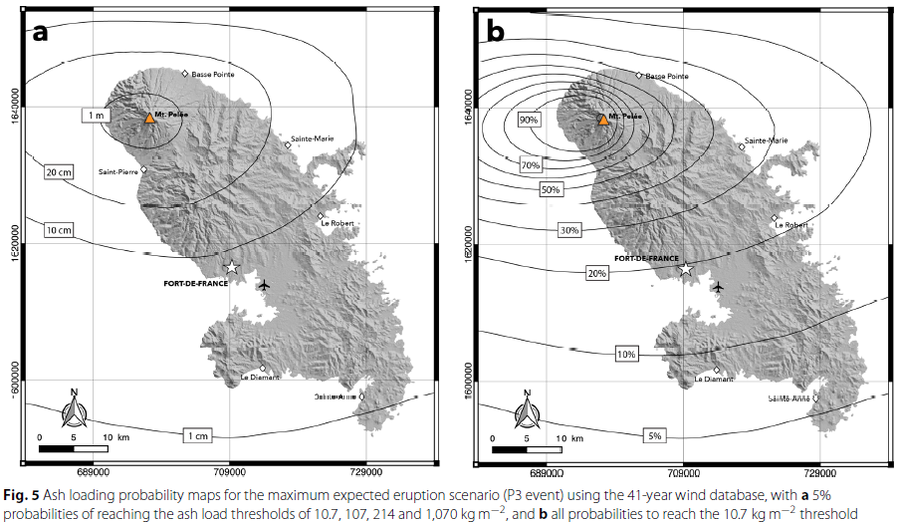
Figure in a journal article
Ash loading probability maps for the maximum expected eruption scenario
Figure 5 in: Michaud-Dubuy, A., Carazzo, G., & Kaminski, E. (2021). Volcanic hazard assessment for tephra fallout in Martinique. Journal of Applied Volcanology, 10(1), 1-20. https://doi.org/10.1186/s13617-021-00106-7.
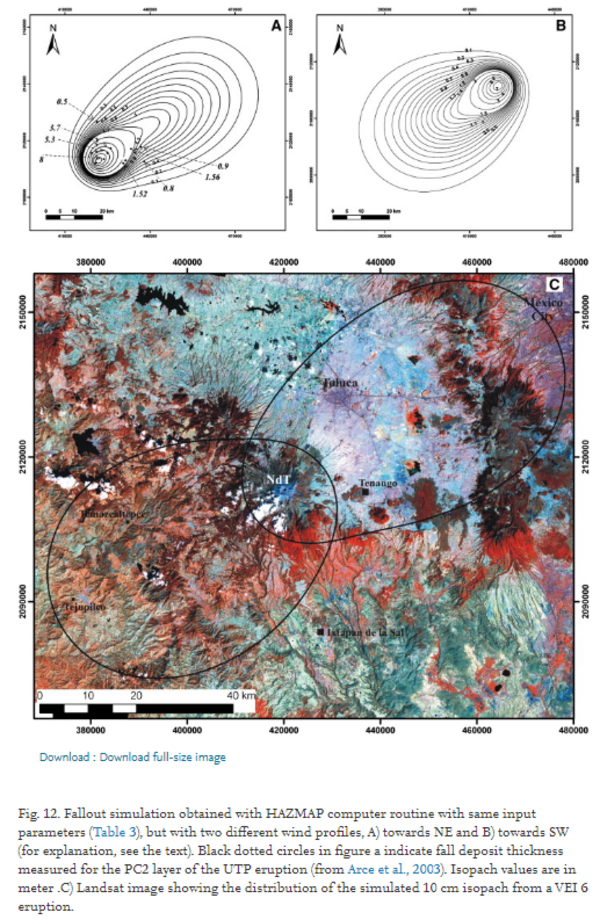
Figure in a journal article
Fallout simulation obtained with HAZMAP computer routine with same input parameters (Table 3), but with two different wind profiles
Figure 12 in: Capra, L., Norini, G., Groppelli, G., Macías, J.L., & Arce, J.L. (2008). Volcanic hazard zonation of the Nevado de Toluca volcano, México. Journal of Volcanology and Geothermal Research, 176(4), p. 469-484. https://doi.org/10.1016/j.jvolgeores.2008.04.016
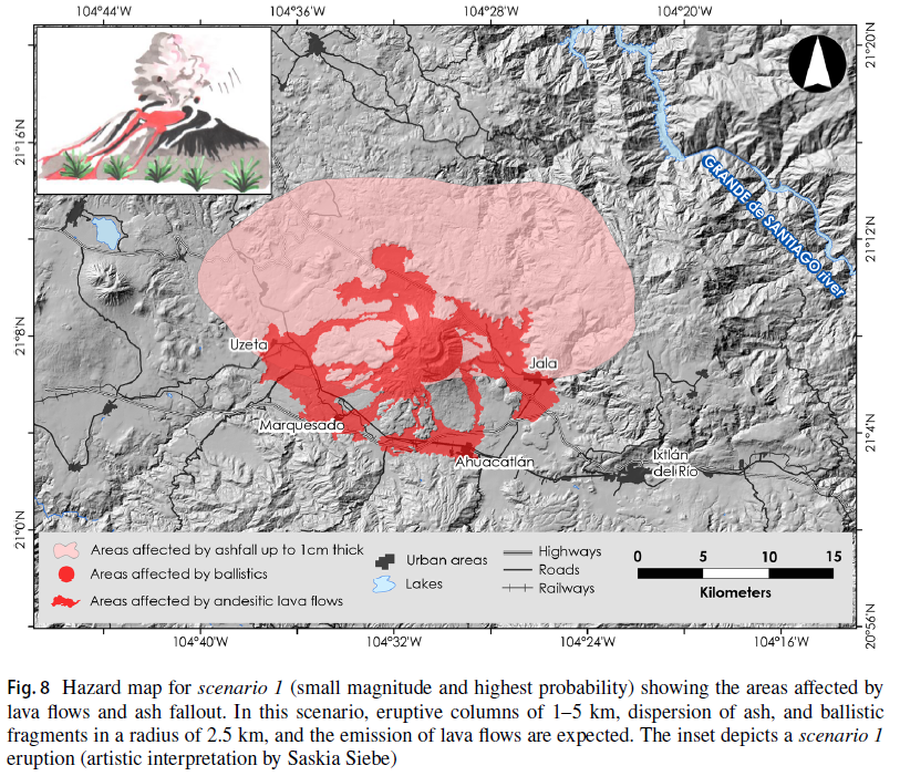
Figure in a journal article
Hazard map for scenario 1 (small magnitude and highest probability) showing the areas affected by lava flows and ash fallout
Figure 8 in: Sieron, K., Ferrés, D., Siebe, C., Constantinescu, R., Capra, L., Connor, C., Connor, L., Groppelli, G. & Zuccolotto, K.G. (2019). Ceboruco hazard map: part II—modeling volcanic phenomena and construction of the general hazard map. Natural Hazards, 96(2), p. 893-933. https://doi.org/10.1007/s11069-019-03577-5
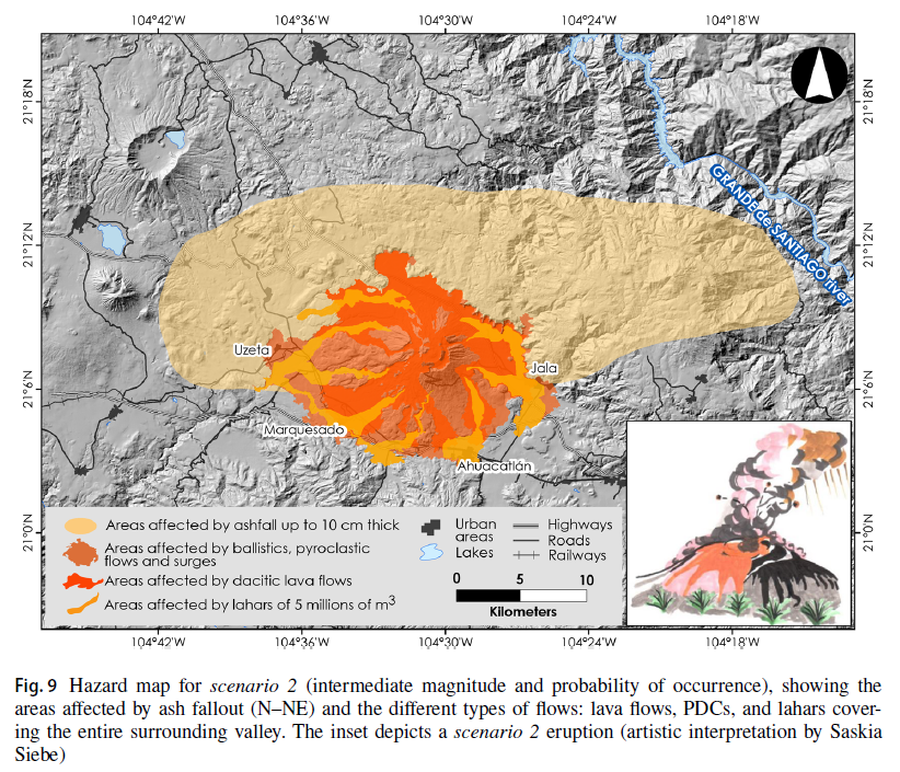
Figure in a journal article
Hazard map for scenario 2 (intermediate magnitude and probability of occurrence), showing the areas affected by ash fallout (N–NE) and the different types of flows: lava flows, PDCs, and lahars covering the entire surrounding valley
Figure 9 in: Sieron, K., Ferrés, D., Siebe, C., Constantinescu, R., Capra, L., Connor, C., Connor, L., Groppelli, G. & Zuccolotto, K.G. (2019). Ceboruco hazard map: part II—modeling volcanic phenomena and construction of the general hazard map. Natural Hazards, 96(2), p. 893-933. https://doi.org/10.1007/s11069-019-03577-5
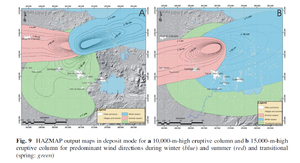
Figure in a journal article
HAZMAP output maps in deposit mode for a 10,000-m-high eruptive column and b 15,000-m-high eruptive column for predominant wind directions during winter (blue) and summer (red) and transitional (spring: green)
Figure 9 in: Sieron, K., Capra, L., & Rodríguez-Elizararrás, S. (2014). Hazard assessment at San Martín volcano based on geological record, numerical modeling, and spatial analysis. Natural hazards, 70(1), 275-297. https://doi.org/10.1007/s11069-013-0807-7
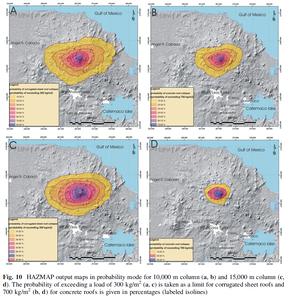
Figure in a journal article
HAZMAP output maps in probability mode for 10,000 m column (a, b) and 15,000 m column (c, d).
Figure 10 in: Sieron, K., Capra, L., & Rodríguez-Elizararrás, S. (2014). Hazard assessment at San Martín volcano based on geological record, numerical modeling, and spatial analysis. Natural hazards, 70(1), 275-297. https://doi.org/10.1007/s11069-013-0807-7