
Advanced Search for Maps
Showing 21-23 of 23
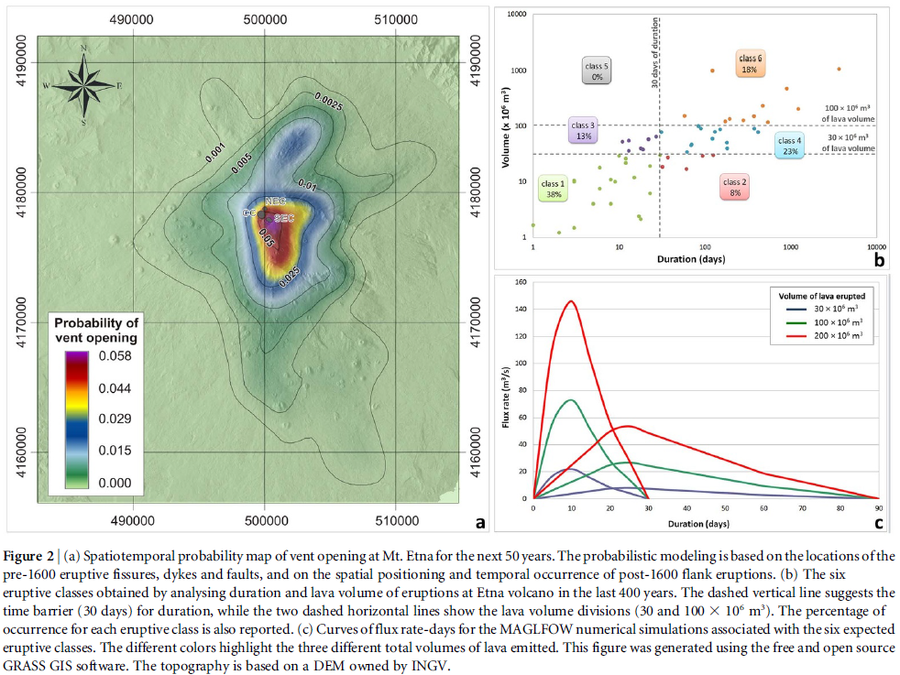
Figure in a journal article
Spatiotemporal probability map of vent opening at Mt. Etna for the next 50 years
Figure 2 in: Del Negro, C., Cappello, A., Neri, M., Bilotta, G., Hérault, A., & Ganci, G. (2013). Lava flow hazards at Mount Etna: constraints imposed by eruptive history and numerical simulations. Scientific Reports, 3(1). https://doi.org/10.1038/srep03493
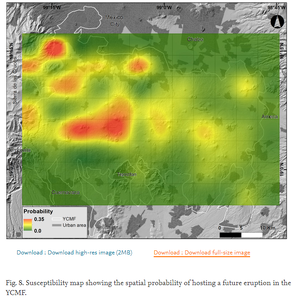
Figure in a journal article
Susceptibility map showing the spatial probability of hosting a future eruption in the YCMF
Figure 8 in: Nieto-Torres, A. & Martin Del Pozzo, A.L. (2019). Spatio-temporal hazard assessment of a monogenetic volcanic field, near México City. Journal of Volcanology and Geothermal Research, 371, 46-58. https://doi.org/10.1016/j.jvolgeores.2019.01.006
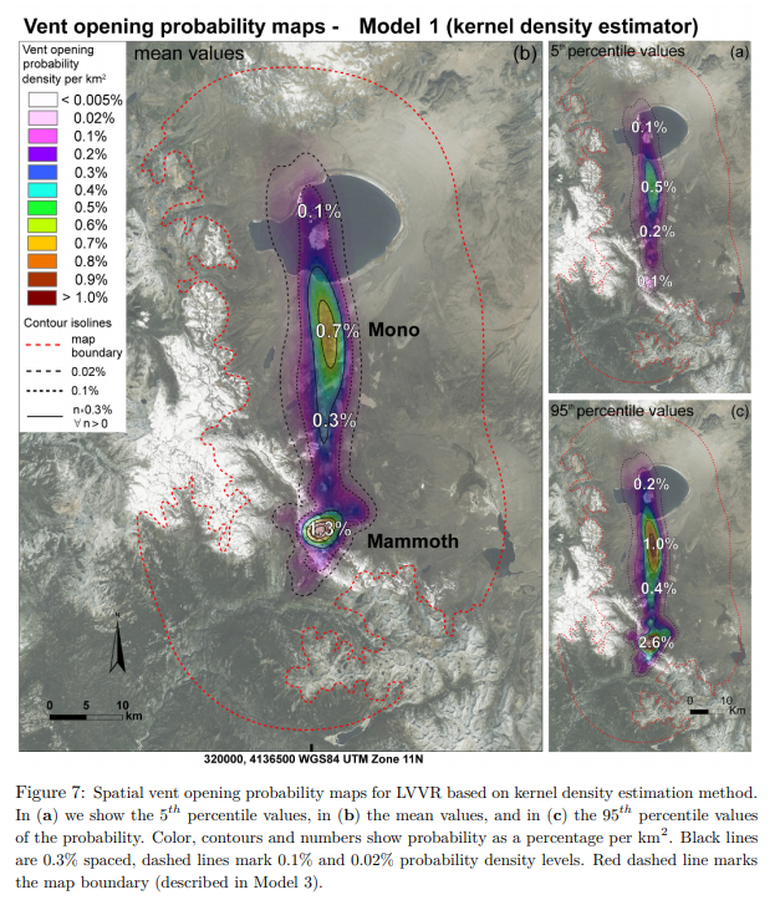
Figure in a journal article
Vent opening probability maps - Model 1 (kernel denisty estimator)
Figure 7 in: Bevilacqua, A., Bursik, M., Patra, A., Pitman, E. B., & Till, R. (2017). Bayesian construction of a long-term vent opening probability map in the Long Valley volcanic region (CA, USA). Statistics in Volcanology, 3(1), 1. http://dx.doi.org/10.5038/2163-338X.3.1