
Advanced Search for Maps
Showing 11-20 of 23
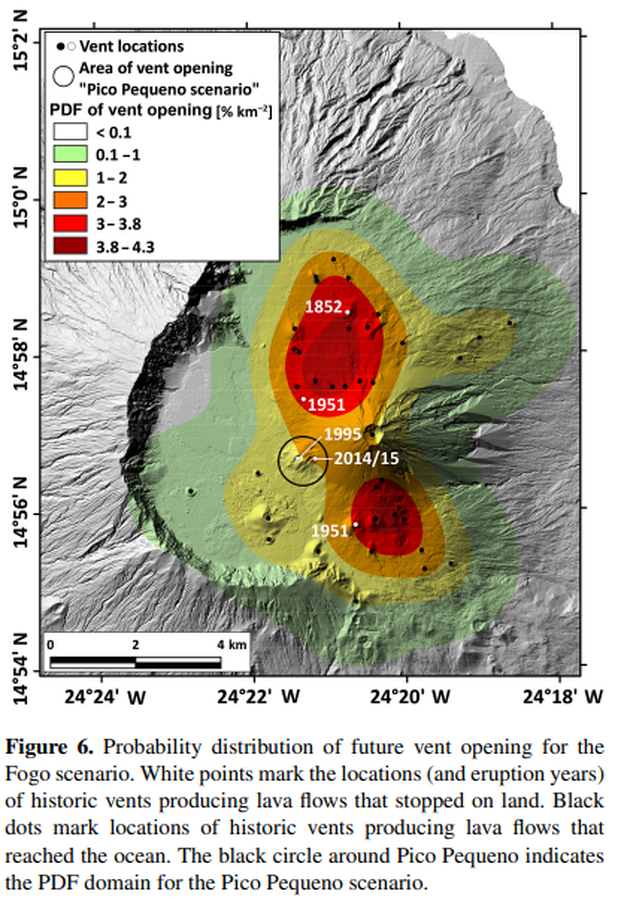
Figure in a journal article
Probability distribution of future vent opening for the Fogo scenario
Figure 6 in: Richter, N., Favalli, M., de Zeeuw-van Dalfsen, E., Fornaciai, A., da Silva Fernandes, R. M., Pérez, N. M., Levy, J., Victoria, S.S., & Walter, T. R. (2016). Lava flow hazard at Fogo Volcano, Cabo Verde, before and after the 2014–2015 eruption. Natural Hazards and Earth System Sciences, 16(8), 1925-1951. https://doi.org/10.5194/nhess-16-1925-2016
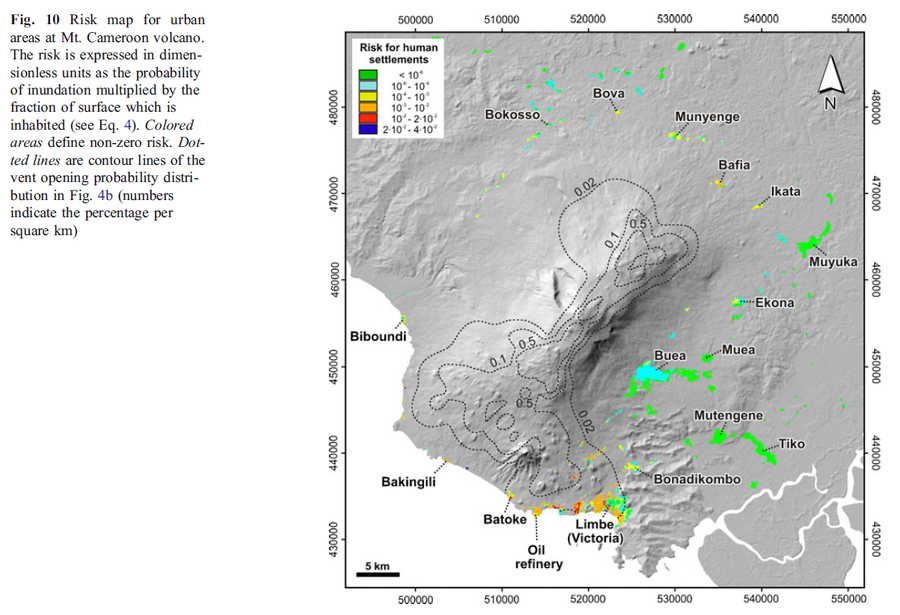
Figure in a journal article
Risk map for urban areas at Mt. Cameroon volcano
Figure 10 in: Favalli, M., Tarquini, S., Papale, P., Fornaciai, A., & Boschi, E. (2012). Lava flow hazard and risk at Mt. Cameroon volcano. Bulletin of Volcanology, 74(2), 423-439. https://doi.org/10.1007/s00445-011-0540-6
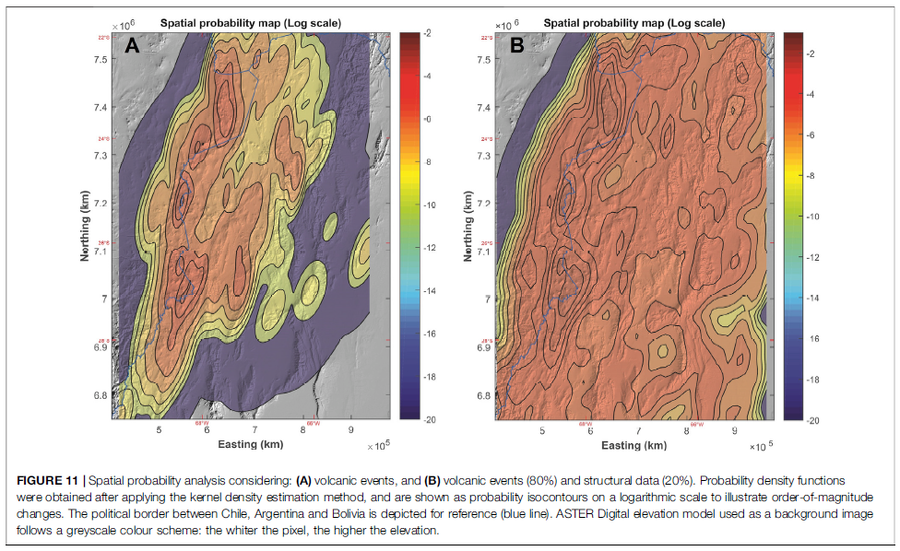
Figure in a journal article
Spatial probability analysis considering: (A) volcanic events, and (B) volcanic events (80%) and structural data (20%)
Figure 11 in: Bertin, D., Lindsay, J.M., Cronin, S.J., de Silva, S.L., Connor, C.B., Caffe, P.J., Grosse, P., Báez, W., Bustos, E., & Constantinescu, R. (2022). Probabilistic Volcanic Hazard Assessment of the 22.5–28° S Segment of the Central Volcanic Zone of the Andes. Frontiers in Earth Science, 10. https://doi.org/10.3389/feart.2022.875439
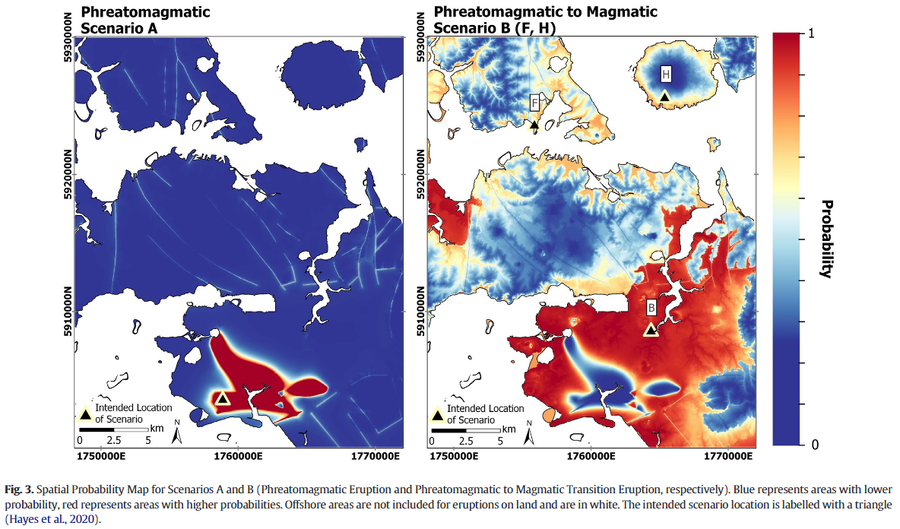
Figure in a journal article
Spatial Probability Map for Scenarios A and B (Phreatomagmatic Eruption and Phreatomagmatic to Magmatic Transition Eruption, respectively)
Figure 3 in: Ang, P. S., Bebbington, M. S., Lindsay, J. M., & Jenkins, S. F. (2020). From eruption scenarios to probabilistic volcanic hazard analysis: An example of the Auckland Volcanic Field, New Zealand. Journal of Volcanology and Geothermal Research, 397, 106871. https://doi.org/10.1016/j.jvolgeores.2020.106871
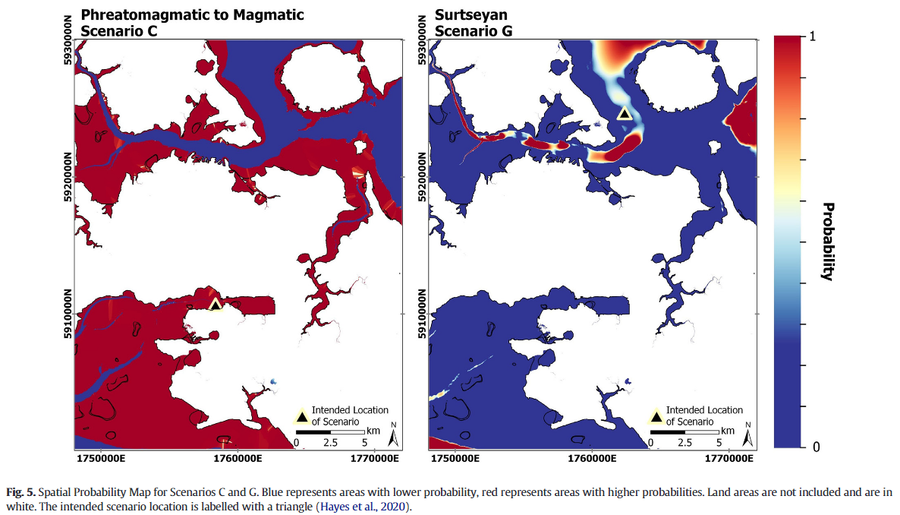
Figure in a journal article
Spatial Probability Map for Scenarios C and G.
Figure 5 in: Ang, P. S., Bebbington, M. S., Lindsay, J. M., & Jenkins, S. F. (2020). From eruption scenarios to probabilistic volcanic hazard analysis: An example of the Auckland Volcanic Field, New Zealand. Journal of Volcanology and Geothermal Research, 397, 106871. https://doi.org/10.1016/j.jvolgeores.2020.106871
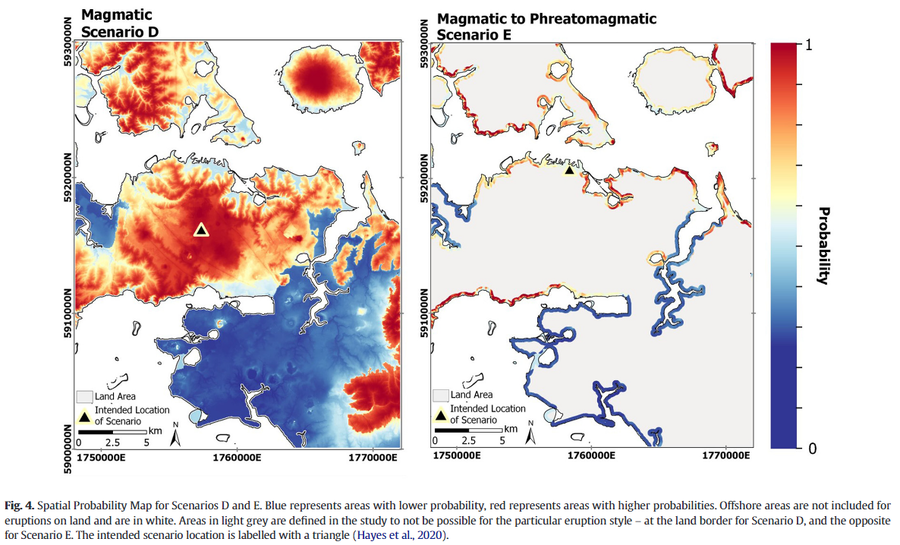
Figure in a journal article
Spatial Probability Map for Scenarios D and E.
Figure 4 in: Ang, P. S., Bebbington, M. S., Lindsay, J. M., & Jenkins, S. F. (2020). From eruption scenarios to probabilistic volcanic hazard analysis: An example of the Auckland Volcanic Field, New Zealand. Journal of Volcanology and Geothermal Research, 397, 106871. https://doi.org/10.1016/j.jvolgeores.2020.106871
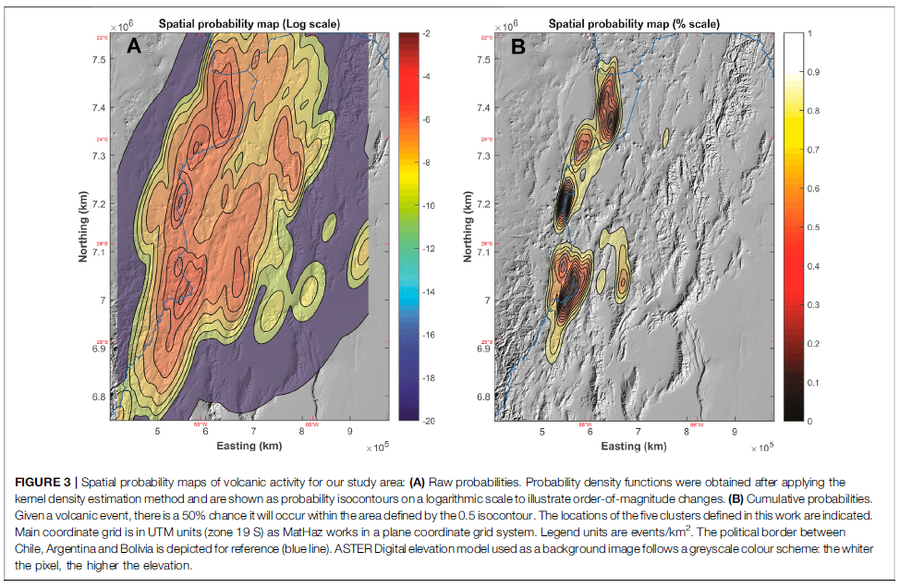
Figure in a journal article
Spatial probability maps of volcanic activity for our study area
Figure 3 in: Bertin, D., Lindsay, J.M., Cronin, S.J., de Silva, S.L., Connor, C.B., Caffe, P.J., Grosse, P., Báez, W., Bustos, E., & Constantinescu, R. (2022). Probabilistic Volcanic Hazard Assessment of the 22.5–28° S Segment of the Central Volcanic Zone of the Andes. Frontiers in Earth Science, 10. https://doi.org/10.3389/feart.2022.875439
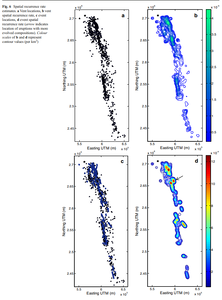
Figure in a journal article
Spatial recurrence rate estimates
Figure 6 in: Runge, M. G., Bebbington, M. S., Cronin, S. J., Lindsay, J. M., Kenedi, C. L., & Moufti, M. R. H. (2014). Vents to events: determining an eruption event record from volcanic vent structures for the Harrat Rahat, Saudi Arabia. Bulletin of Volcanology, 76(3), 1-16. https://doi.org/10.1007/s00445-014-0804-z
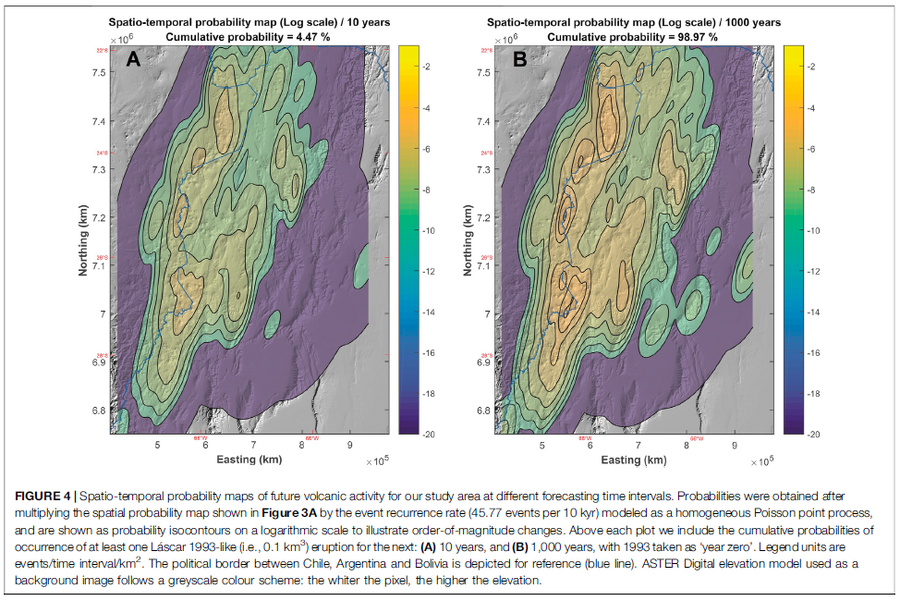
Figure in a journal article
Spatio-temporal probability maps of future volcanic activity for our study area at different forecasting time intervals
Figure 4 in: Bertin, D., Lindsay, J.M., Cronin, S.J., de Silva, S.L., Connor, C.B., Caffe, P.J., Grosse, P., Báez, W., Bustos, E., & Constantinescu, R. (2022). Probabilistic Volcanic Hazard Assessment of the 22.5–28° S Segment of the Central Volcanic Zone of the Andes. Frontiers in Earth Science, 10. https://doi.org/10.3389/feart.2022.875439

Figure in a journal article
Spatiotemporal probability map of vent opening at Mt. Etna for the next 10 years within the summit area
Figure 4 in: Del Negro, C., Cappello, A., Neri, M., Bilotta, G., Hérault, A., & Ganci, G. (2013). Lava flow hazards at Mount Etna: constraints imposed by eruptive history and numerical simulations. Scientific Reports, 3(1). https://doi.org/10.1038/srep03493