
Advanced Search for Maps
Showing 31-40 of 387
Official, Figure in hazard assessment
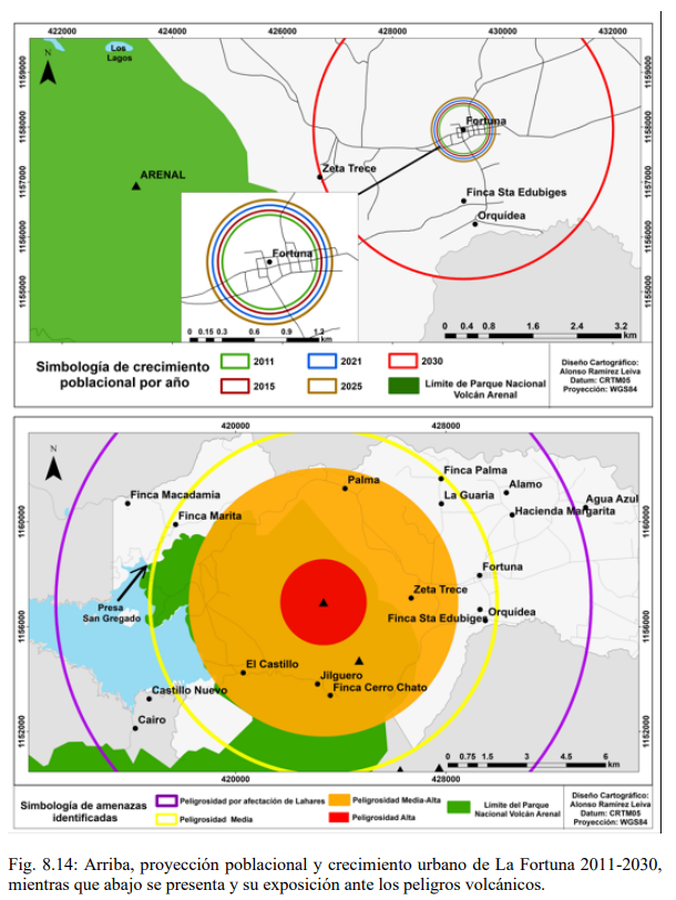
Arriba, proyección poblacional y crecimiento urbano de La Fortuna 2011-2030, mientras que abajo se presenta y su exposición ante los peligros volcánicos
(Above, population projection and urban growth of La Fortuna 2011-2030, while below it is presented and its exposure to volcanic dangers)
Figure 8.14 in: Alvarado, G.E., Brenes-André, F., Núñez, D., Borbón, J., Ramírez, M.A., Alpízar, Y., Núñez, S., Sibaja, J.P., Esquivel, L. (2023). Actualización del Análisis del Peligro Volcánico del Arenal, Costa Rica. Instituto Costarricense de Electricidad (ICE). Mayo 2023.

Official, Figure on website
Ashfall model output for Yellowstone supereruption
U.S. Geological Survey (USGS). (2014). Ashfall model output for Yellowstone supereruption. U.S. Geological Survey. Modeling the Ash Distribution of a Yellowstone Supereruption (2014). https://www.usgs.gov/volcanoes/yellowstone/modeling-ash-distribution-yellowstone-supereruption-2014 (Simplified from: Mastin et al. 2014)
Official, Map sheet or poster
Ashigarakami District Volcanic Disaster Prevention Map
Figure 6.3.14 in: Mt. Fuji Hazard Map Review Committee. (2004). Mt. Fuji Hazard Map Review Committee Report. June 2004. https://www.bousai.go.jp/kazan/fuji_map/pdf/report_200406.pdf
Official, Flyer, brochure, short fact-sheet, or handout
Asosan Volcanic Alert Levels
Japan Meteorological Agency. (2019). Asosan Volcanic Alert Levels. Volcano Monitoring and Warning Center, Volcano Division, Earthquake and Volcano Department.
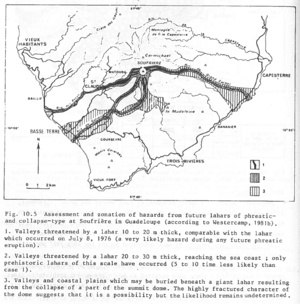
Figure in a journal article
Assessment and zonation of hazards from future lahars of phreatic and collapse-type at Soufrière in Guadeloupe (according to Westercamp, 1981b)
Figure 10.5 in: Westercamp, D. (1983). Appraisal and zonation of volcanic hazards in the French Lesser Antilles: preliminary results. In: Tazieff, H. & Sabroux, J.-C. (Eds.) Forecasting Volcanic Events, Elsevier, Amsterdam, p. 111-130.
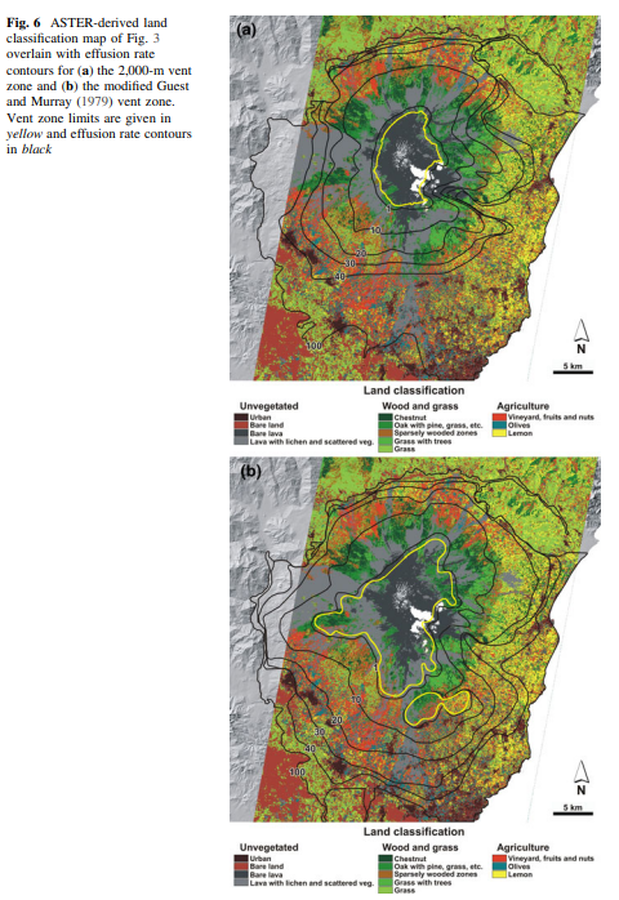
Figure in a journal article
ASTER-derived land classification map of Fig. 3 overlain with effusion rate contours for the 2,000-m vent zone and the modified Guest and Murray (1979) vent zone
Figure 6 in: Harris, A. J., Favalli, M., Wright, R., & Garbeil, H. (2011). Hazard assessment at Mount Etna using a hybrid lava flow inundation model and satellite-based land classification. Natural Hazards, 58(3), 1001-1027. https://doi.org/10.1007/s11069-010-9709-0
Official, Flyer, brochure, short fact-sheet, or handout
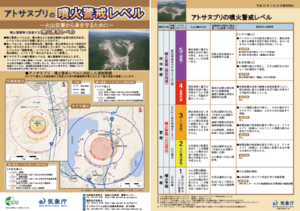
Atosanupuri Volcanic Alert Levels
Japan Meteorological Agency. (2018). Atosanupuri Volcanic Alert Levels. Volcano Monitoring and Warning Center, Volcano Division, Earthquake and Volcano Department.
Official, Flyer, brochure, short fact-sheet, or handout
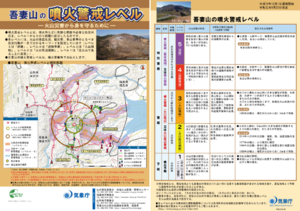
Azumayama Volcanic Alert Levels
Japan Meteorological Agency. (2019). Azumayama Volcanic Alert Levels. Volcano Monitoring and Warning Center, Volcano Division, Earthquake and Volcano Department.
Official, Flyer, brochure, short fact-sheet, or handout
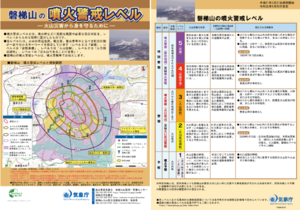
Bandaisan Volcanic Alert Levels
Japan Meteorological Agency. (2019). Bandaisan Volcanic Alert Levels. Volcano Monitoring and Warning Center, Volcano Division, Earthquake and Volcano Department.
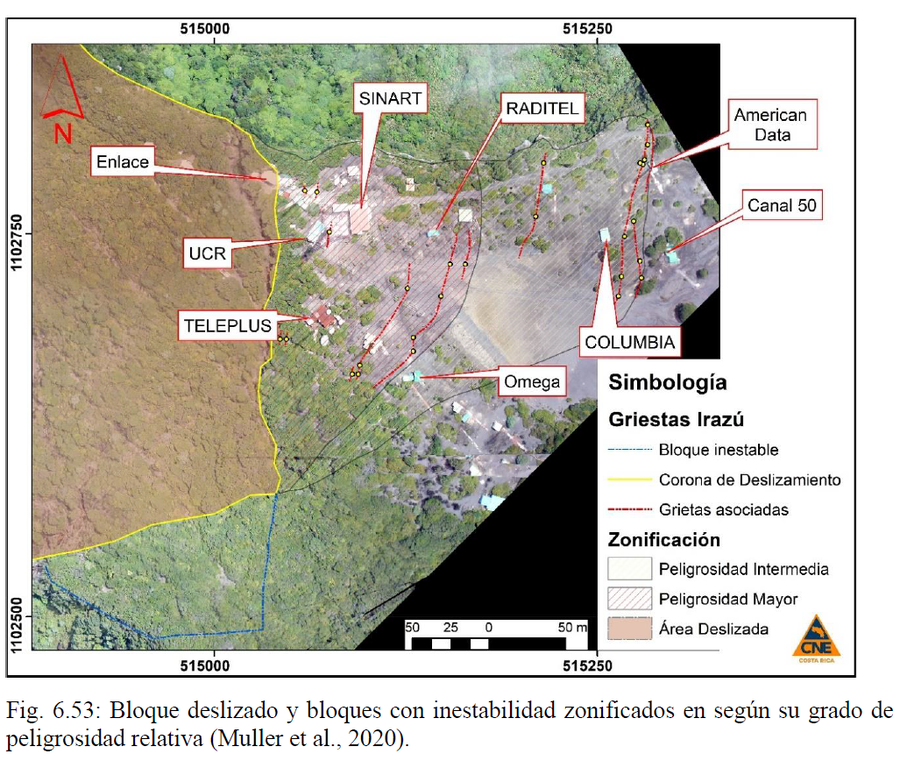
Official, Figure in hazard assessment
Bloque deslizado y bloques con inestabilidad zonificados en según su grado de peligrosidad relativa
(Sliding block and blocks with instability zoned according to their degree of relative danger)
Figure 6.53 in: Alvarado, G.E., Campos-Durán, D., Brenes-André, J., Alpízar, Y., Núñez, S., Esquivel, L., Sibaja, J.P. & Fallas, B. (2021). Peligro Volcánico del Irazú, Costa Rica. Comisión Nacional de Prevención de Riesgos y Atención de Emergencias (CNE). Deciembre 2021. (Modified from: Muller et al., 2020).