
Advanced Search for Maps
Showing 341-349 of 349

Official, Figure in hazard assessment
Zones of relative risk from lava flows
Figure 4 in: Crandell, D. R. (1975). Assessment of volcanic risk on the island of Oahu, Hawaii. U.S. Geological Survey, Open-File Report 75-287. https://doi.org/10.3133/ofr75287
Official, Figure in hazard assessment
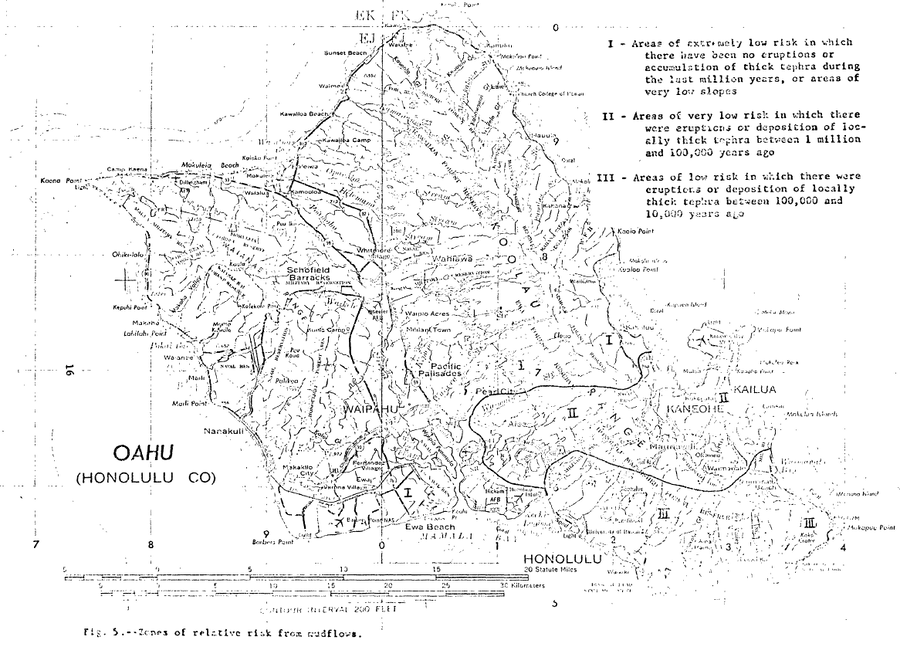
Zones of relative risk from mudflows
Figure 5 in: Crandell, D. R. (1975). Assessment of volcanic risk on the island of Oahu, Hawaii. U.S. Geological Survey, Open-File Report 75-287. https://doi.org/10.3133/ofr75287
Official, Figure in hazard assessment
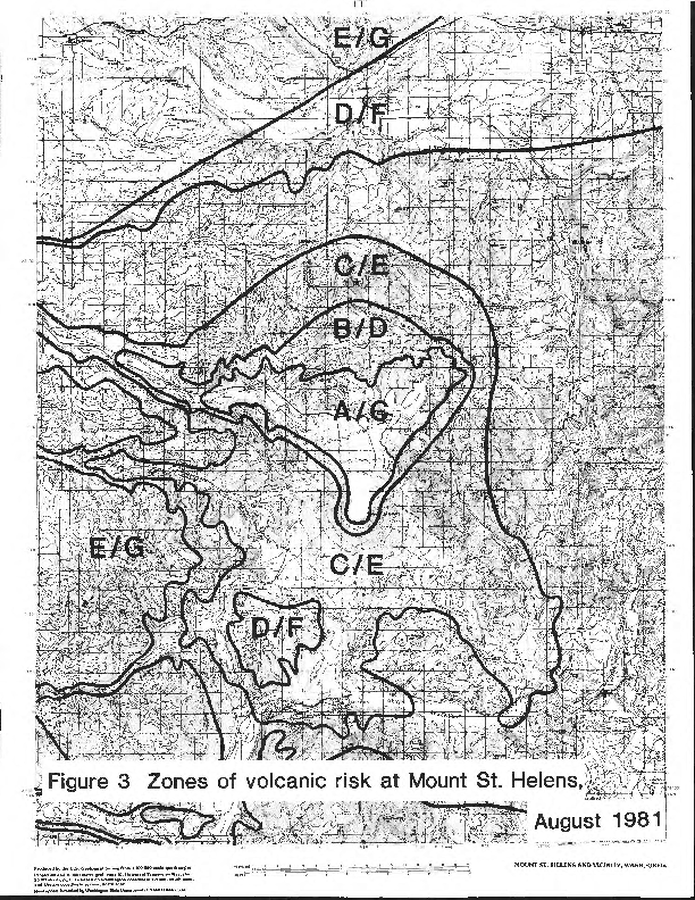
Zones of volcanic risk at Mount St. Helens August 1981
Figure 3 in: Newhall, C.G. (1982). A method for estimating intermediate- and long-term risks from volcanic activity, with an example from Mount St. Helens, Washington. U.S. Geological Survey, Open-File Report 82-396, 59 p. doi: 10.3133/ofr82396
Official, Figure in hazard assessment
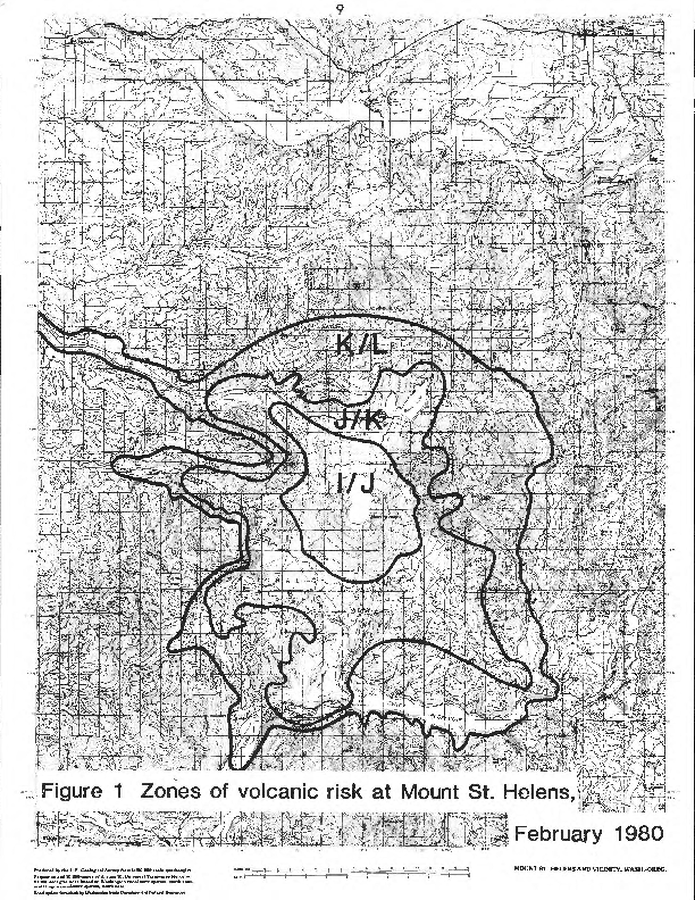
Zones of volcanic risk at Mount St. Helens February 1980
Figure 1 in: Newhall, C.G. (1982). A method for estimating intermediate- and long-term risks from volcanic activity, with an example from Mount St. Helens, Washington. U.S. Geological Survey, Open-File Report 82-396, 59 p. doi: 10.3133/ofr82396
Official, Figure in hazard assessment
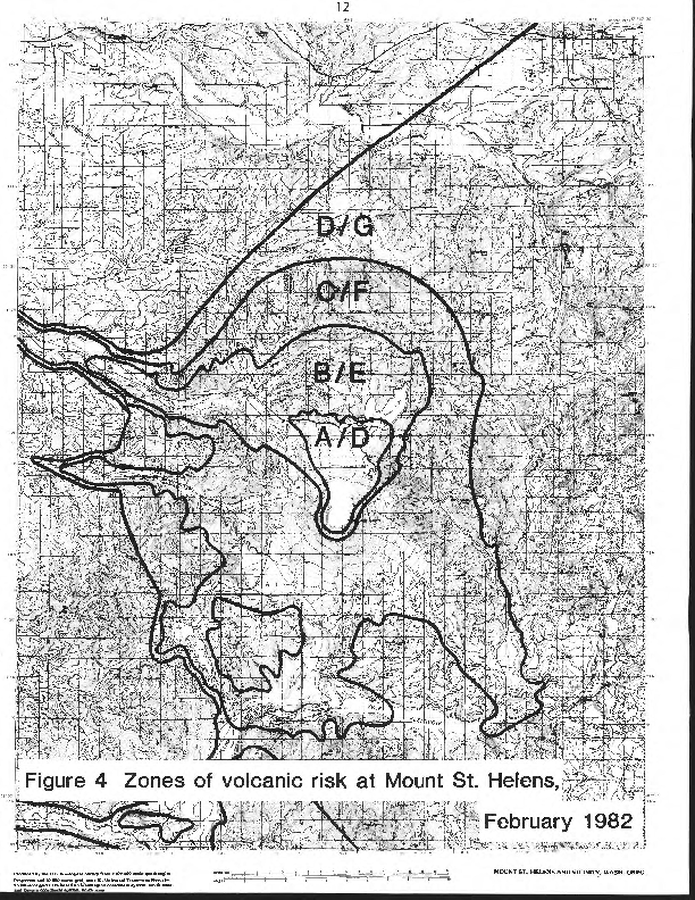
Zones of volcanic risk at Mount St. Helens February 1982
Figure 4 in: Newhall, C.G. (1982). A method for estimating intermediate- and long-term risks from volcanic activity, with an example from Mount St. Helens, Washington. U.S. Geological Survey, Open-File Report 82-396, 59 p. doi: 10.3133/ofr82396
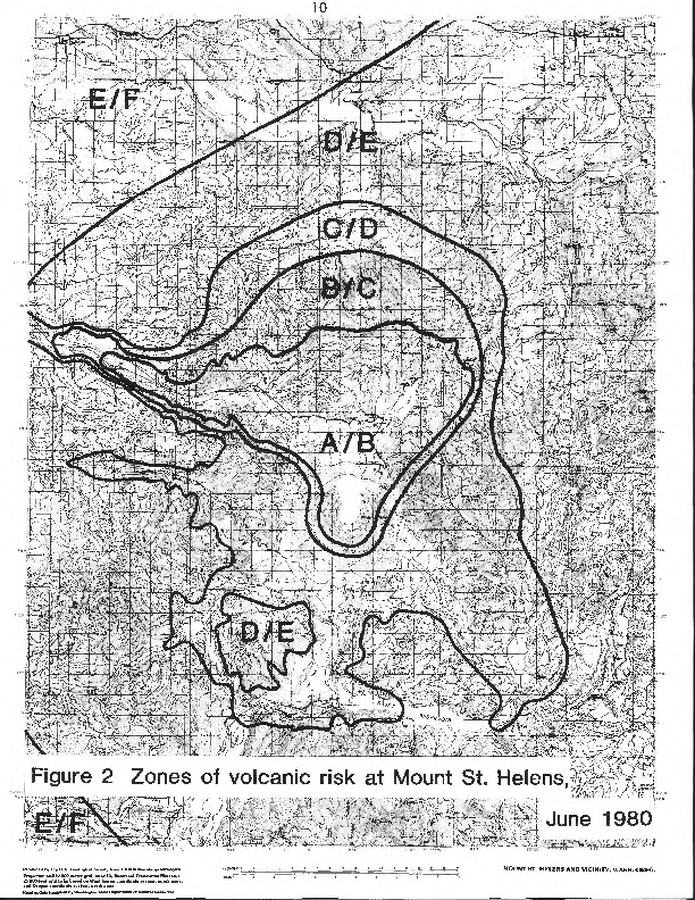
Official, Figure in hazard assessment
Zones of volcanic risk at Mount St. Helens June 1980
Figure 2 in: Newhall, C.G. (1982). A method for estimating intermediate- and long-term risks from volcanic activity, with an example from Mount St. Helens, Washington. U.S. Geological Survey, Open-File Report 82-396, 59 p. doi: 10.3133/ofr82396
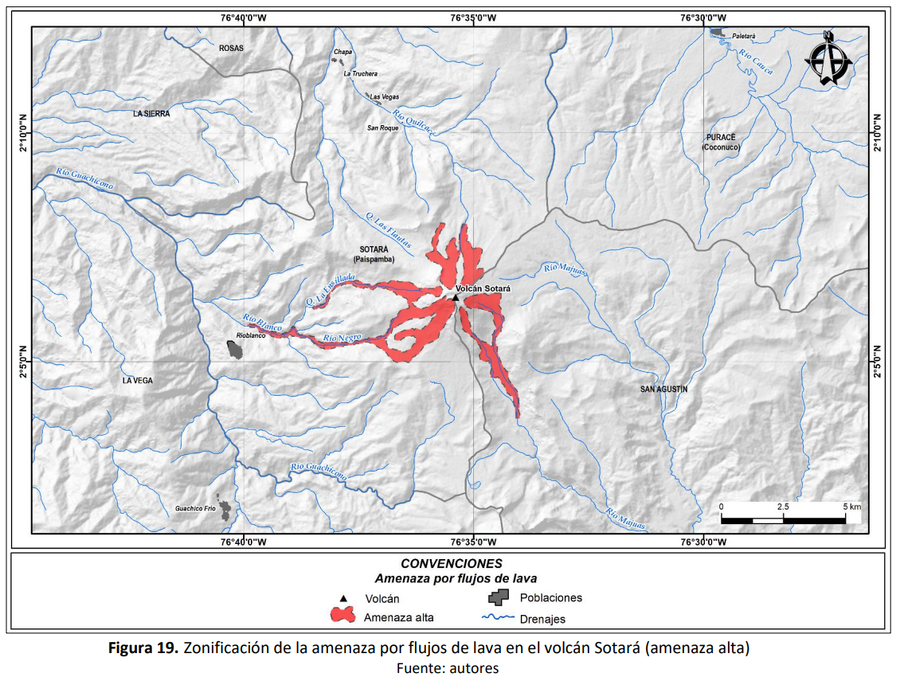
Official, Figure in hazard assessment
Zonificación de la amenaza por flujos de lava en el volcán Sotará (amenaza alta)
(Zoning of the lava flow hazard of Sotará volcano (high hazard))
Figure 19 in: Pulgarín, B., Zuluaga, I., Galarza, J. Muñoz, C. y Laverde, C. (2019). Memoria del mapa de amenaza volcánica del volcán Sotará. Popayán, Pasto y Bogotá: Servicio Geológico Colombiano.
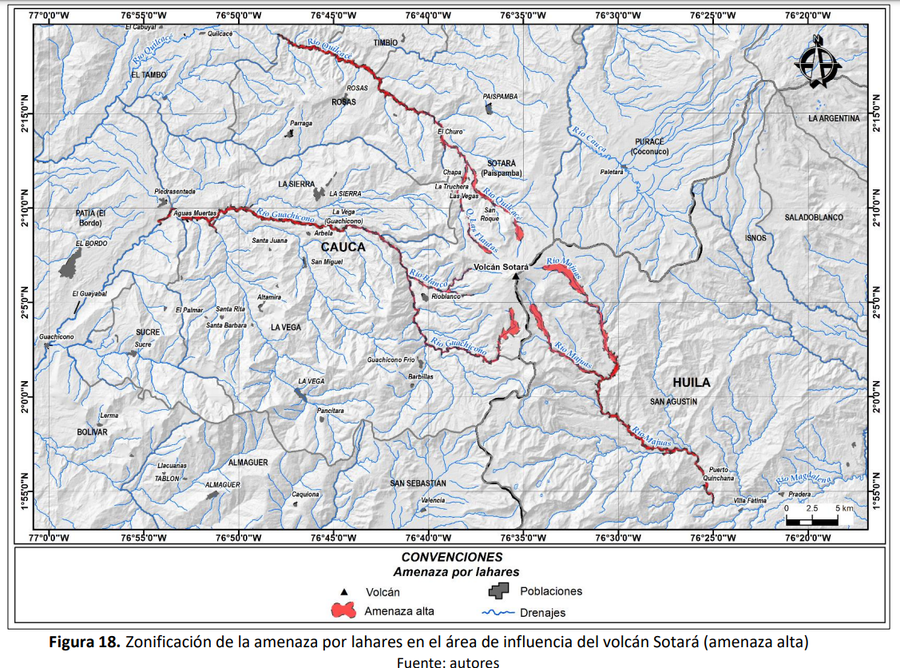
Official, Figure in hazard assessment
Zonificación de la amenaza por lahares en el área de influencia del volcán Sotará (amenaza alta)
(Zoning of the lahar hazard in the area of influence of the Sotará volcano (high hazard))
Figure 18 in: Pulgarín, B., Zuluaga, I., Galarza, J. Muñoz, C. y Laverde, C. (2019). Memoria del mapa de amenaza volcánica del volcán Sotará. Popayán, Pasto y Bogotá: Servicio Geológico Colombiano.
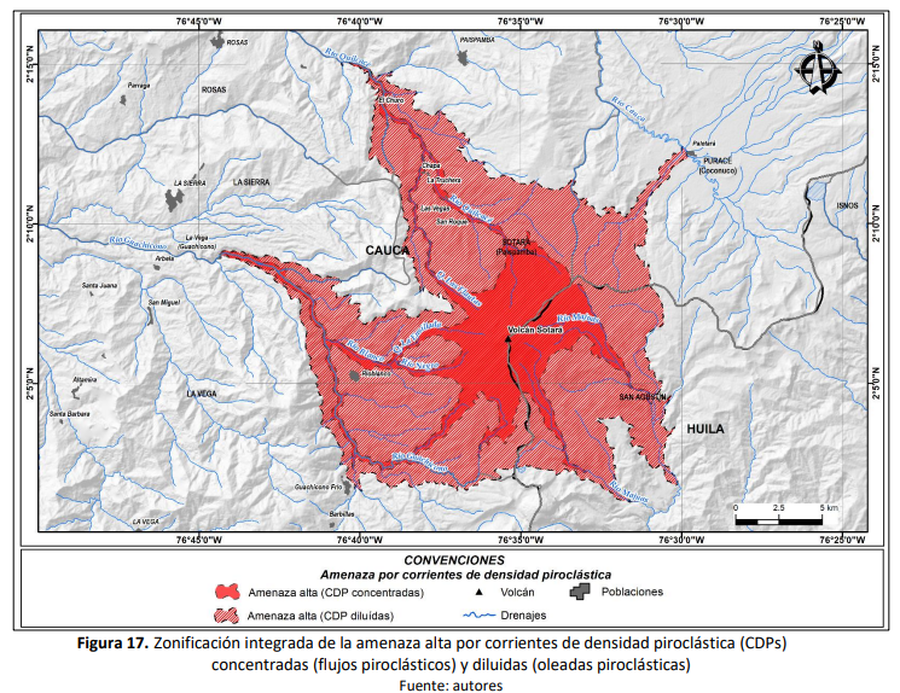
Official, Figure in hazard assessment
Zonificación integrada de la amenaza alta por corrientes de densidad piroclástica (CDPs) concentradas (flujos piroclásticos) y diluidas (oleadas piroclásticas)
(Integrated high hazard zoning of concentrated (pyroclastic flows) and diluted (pyroclastic surges) pyroclastic density currents (PDCs))
Figure 17 in: Pulgarín, B., Zuluaga, I., Galarza, J. Muñoz, C. y Laverde, C. (2019). Memoria del mapa de amenaza volcánica del volcán Sotará. Popayán, Pasto y Bogotá: Servicio Geológico Colombiano.