← Back to Search Results

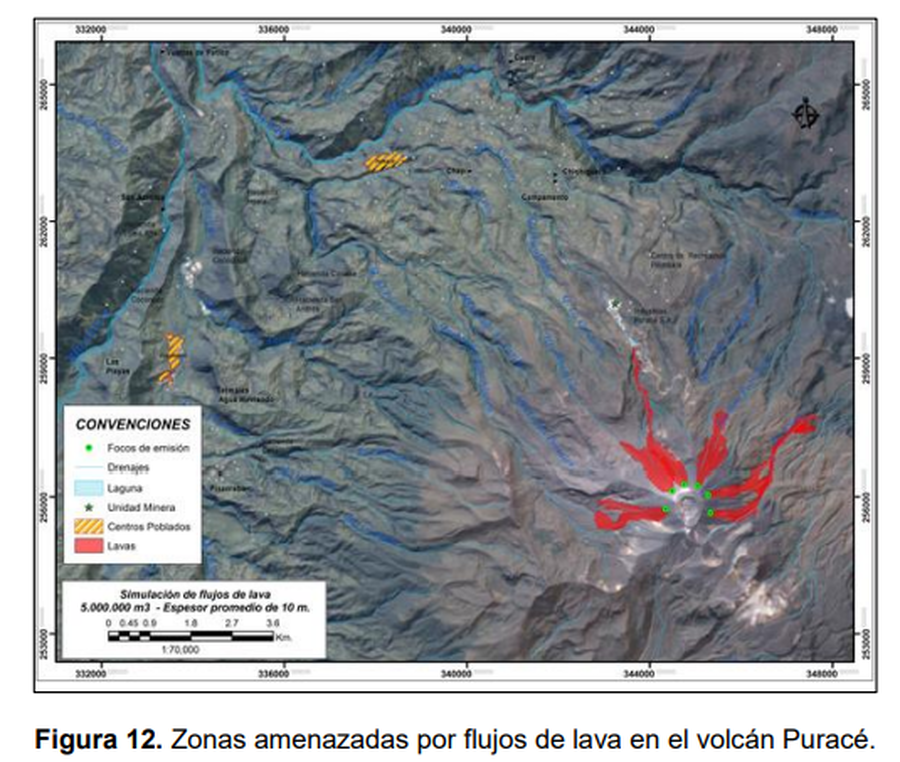
Simulación de flujos de lava, 5,000,000 m³ - Espesor promedio de 10 m

Simulation of lava flows, 5,000,000 m³ - Average thickness of 10 m

Puracé, Colombia, 2014

Figure 12 in: Monsalve, M.L., Galarza, J.J., Zuluaga, I., & Laverde, C.A. (2014). Mapa de Amenaza Volcanica Purace Actual (Cuaca-Colombia), Segunda Version. Servicio Geologico Colombiano (SGC), Bogotá


This map was produced by an official agency, but may not be the most recent, most complete, or main operational map. For the current operational hazard map, please consult the proper institutional authorities.


Click on image for full-size map. If link seems broken, try the archived version.

Map Set

Monsalve, M.L., Galarza, J.J., Zuluaga, I., & Laverde, C.A. (2014). Mapa de Amenaza Volcanica Purace Actual, Segunda Version. Servicio Geologico Colombiano (SGC), Bogotá
https://www2.sgc.gov.co/sgc/volcanes/VolcanPurace/Documents/Memoria_MapaAmenaza_Purace.pdf

Other Maps In Set:

Map Data

Map ID1278
Hazard Process(es)Lava flows
Hazard Zone PresentationSingle hazard: A single hazard process is represented on a main map panel
Temporal ScaleBackground, or long-term, map
Spatial ScaleVolcano and surrounding area
Publication FormatFigure in a hazard assessment or mitigation plan
Zonation Method(s)Scenario modeling
Zonation Model(s)LavaPL (Connor et al. 2012)
Scenario(s) ConsideredSize, VEI, or intensity; Source location or direction
Hazard Zone Label(s)Hazard process name
Probability Definition(s)No probability definition was discernable from the map
PurposeMultiple: intended for multiple purposes including general hazard awareness, planning, and crisis management
AudienceMultiple audiences (usually the public, civil authorities, and land-use planners)
Language(s)Spanish
Basemap(s)Satellite image
Basemap overlay(s)Hillshade
DiemsionalityPlanimetric (2D or map) view
Color SchemeSingle color
Go to Global Volcanism Program page for Puracé →