← Back to Search Results

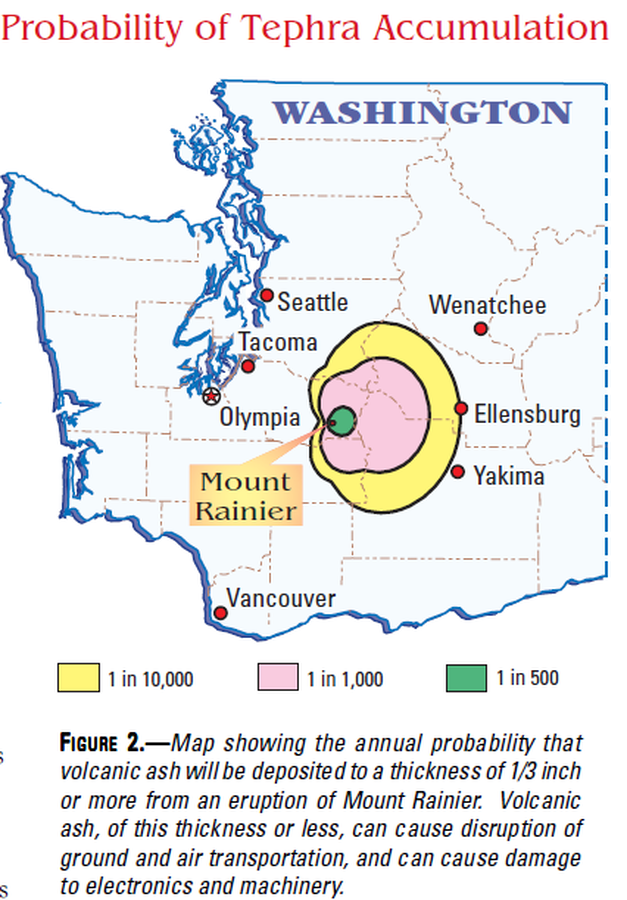
Probability of Tephra Accumulation

Rainier, United States, 2002

Figure 2 in: Driedger, C.L. & Scott, K.M. (2002). Mount Rainier: learning to live with volcanic risk. U.S. Geological Survey, Fact Sheet 034-02, 4 p. https://doi.org/10.3133/fs03402


This map was produced by an official agency, but is NOT the most recent, most complete, or main operational map. For the current operational hazard map, please consult the proper institutional authorities.


Click on image for full-size map. If link seems broken, try the archived version.

Map Set

Driedger, C.L. & Scott, K.M. (2002). Mount Rainier: learning to live with volcanic risk. U.S. Geological Survey, Fact Sheet 034-02, 4 p. https://doi.org/10.3133/fs03402
https://doi.org/10.3133/fs03402

Other Maps In Set:

Map Data

Map ID1394
Hazard Process(es)Tephra fall
Hazard Zone PresentationSingle hazard: A single hazard process is represented on a main map panel
Temporal ScaleBackground, or long-term, map
Spatial ScaleRegional
Publication FormatMap in a booklet, longer fact-sheet, handbook, or guidebook
Zonation Method(s)Scenario modeling
Zonation Model(s)Unnamed tephra model [Hoblitt et al. (1987); Hoblitt & Scott (2011)] (Hoblitt et al. 1987; Hoblitt & Scott 2011)
Scenario(s) ConsideredAnalog volcano(es)
Hazard Zone Label(s)Numeric probability
Probability Definition(s)Annual numeric probability
PurposeHazard awareness: Intended for educating the audience about the extent and probability of volcanic hazard
AudienceGeneral public and/or media
Language(s)English
Basemap(s)Administrative boundaries (e.g. county, park, intl.)
Basemap overlay(s)
DiemsionalityPlanimetric (2D or map) view
Color SchemeCategorical/Qualitative
Go to Global Volcanism Program page for Rainier →