
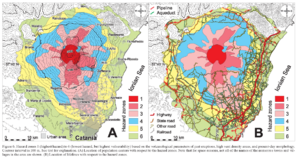
Hazard zones 1 (highest hazard) to 6 (lowest hazard, but highest vulnerability) based on the volcanological parameters of past eruptions, high vent density areas, and present day morphology
Etna, Italy, 2005
Figure 6 in: Behncke, B., Neri, M., & Nagay, A. (2005). Lava flow hazard at Mount Etna (Italy): new data from a GIS-based study. In: Manga, M. and Ventura, G. Kinematics and Dynamics of Lava Flows. Geological Society of America, Special Paper 396. https://doi.org/10.1130/0-8137-2396-5.189
This hazard map is the result of scientific research and was published in academic literature.
It is presented here to serve as an example of the map type or the map-making methodology. It is NOT the official, operational map. For the current operational hazard map, please consult the proper institutional authorities.
Click on thumbnail for full-size map. We do not have copyright permission to display the full-size image. If you are the copyright holder and wish to provide copyright, please contact us at admin@volcanichazardmaps.org.