
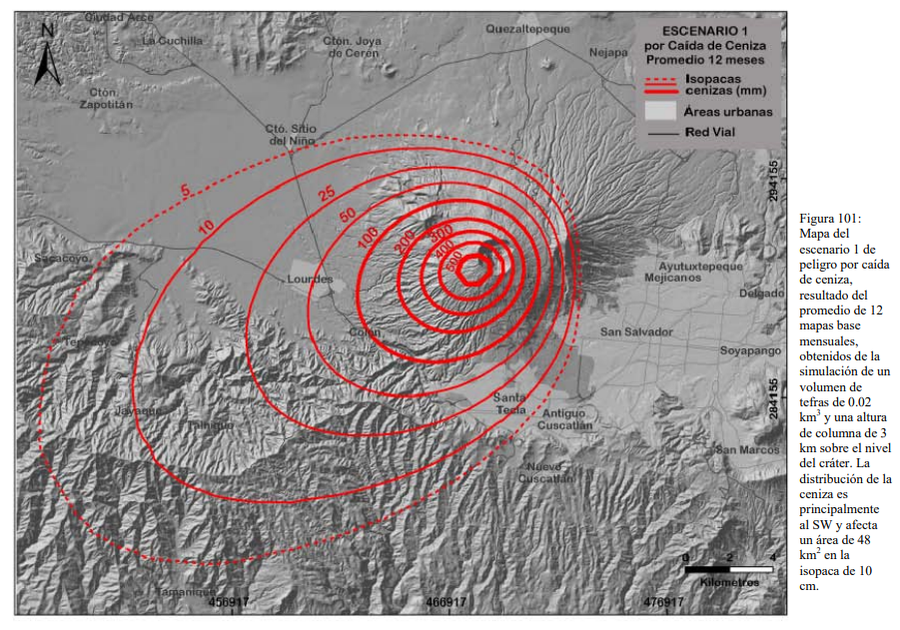
Escenario 1 por Caida de Ceniza Promedio 12 Meses
Scenario 1 for Average Ash Fall 12 Months
San Salvador, El Salvador, 2014
Figure 101 in: Ferrés López, M.D. (2014). Estratigrafía, Geología y Evaluación de Peligros Volcánicos del Complejo Volcánico de San Salvador (El Salvador). Doctoral Thesis, Universidad Autónoma de México, México.
This hazard map is the result of scientific research and was published in academic literature.
It is presented here to serve as an example of the map type or the map-making methodology. It is NOT the official, operational map. For the current operational hazard map, please consult the proper institutional authorities.
Click on image for full-size map. If link seems broken, try the archived version.
Ferrés D. (2014). Estratigrafía, Geología y Evaluación de Peligros Volcánicos del Complejo Volcánico de San Salvador (El Salvador). Doctoral Thesis, Universidad Autónoma de México, México. Map Set
https://ru.dgb.unam.mx/handle/DGB_UNAM/TES01000711745
Other Maps In Set: