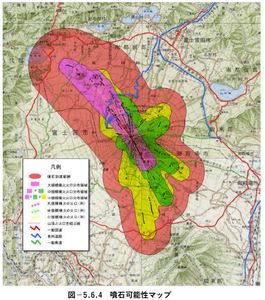
Volcanic bomb possibility map
Fujisan, Japan, 2004
Figure 5.6.4 in: Mt. Fuji Hazard Map Review Committee. (2004). Mt. Fuji Hazard Map Review Committee Report. June 2004. https://www.bousai.go.jp/kazan/fuji_map/pdf/report_200406.pdf
This map was produced by an official agency, but is NOT the most recent, most complete, or main operational map.
For the current operational hazard map, please consult the proper institutional authorities.

Click on thumbnail for full-size map. We do not have copyright permission to display the full-size image. If you are the copyright holder and wish to provide copyright, please contact us at admin@volcanichazardmaps.org. If link seems broken, try the archived version.
Map Set
Mt. Fuji Hazard Map Review Committee. (2004). Mt. Fuji Hazard Map Review Committee Report. June 2004. https://www.bousai.go.jp/kazan/fuji_map/pdf/report_200406.pdf
https://www.bousai.go.jp/kazan/fuji_map/pdf/report_200406.pdf
Other Maps In Set:
- Volcanic Disaster Prevention Map of Mt.Fuji
- Fuji City Volcano Disaster Prevention Map
- Ashigarakami District Volcanic Disaster Prevention Map
- Odawara City Volcano Disaster Prevention Map
- Fujiyoshida City Volcano Disaster Prevention Map
- Gotemba Volcano Disaster Prevention Map
- Assumed crater range for each scale
- Lava flow scenario map (arrival time of lava for small-scale eruptions)
- Lava flow scenario map (arrival time of lava for medium-scale eruptions)
- Lava flow scenario map (arrival time of lava for large-scale eruptions)
- Pyroclastic flow scenario map
- Scenario map of snow-melting lahar
- Monthly large-scale prediction distribution of ash fall using the average meteorological field over the past 45 years (January-June)
- Monthly large-scale prediction distribution of ash fall using the average meteorological field over the past 45 years (July-December)
- Monthly medium-scale eruption ash fall prediction distribution using the average meteorological field over the past 45 years (January-June)
- Monthly medium-scale eruption ash fall prediction distribution using the average meteorological field over the past 45 years (July-December)
- Monthly small-scale eruption ash fall prediction distribution using the average meteorological field over the past 45 years (January-June)
- Monthly small-scale eruption ash fall prediction distribution using the average meteorological field over the past 45 years (July-December)
- Lava flow possibility map
- Pyroclastic flow/pyroclastic surge possibility map
- Snow-melting type lahar possibility map
- Ash fall possibility map
- Volcanic bomb reachability range medium/small scale (2km)
- Volcanic bomb reachability range large scale (4km)
- Debris flow possibility map
- Volcano disaster prevention map (assumed crater)
- Volcano disaster prevention map (lava flow)
- Volcano disaster prevention map (Pyroclastic flow/pyroclastic surge)
- Volcano disaster prevention map (Snow melting type volcanic mudflow)
- Volcanic disaster prevention map (volcanic bomb)
- Volcano disaster prevention map (ash fall)
- Volcano disaster prevention map (debris flow)
Map Data
Map ID | 3527 |
---|---|
Hazard Process(es) | Ballistics; Vent-opening hazards |
Hazard Zone Presentation | Hazard process-focused: Most hazard processes are separated by hazard process type on a main map panel |
Temporal Scale | Background, or long-term, map |
Spatial Scale | Volcano and surrounding area |
Publication Format | Figure in a hazard assessment or mitigation plan |
Zonation Method(s) | Scenario modeling |
Zonation Model(s) | Frequency magnitude, recurrence rate, or other probability density function model (No reference) |
Scenario(s) Considered | Size, VEI, or intensity; Source location or direction |
Hazard Zone Label(s) | Hazard process name |
Probability Definition(s) | Scenarios imply probability |
Purpose | Land-use planning: Intended to inform citing of facilities, building restrictions, resource management, and infrastructure development |
Audience | Land-use planners, city planners, government officials, etc. |
Language(s) | Japanese |
Basemap(s) | Topographic map (colored contour map) |
Basemap overlay(s) | Contour lines; Street map |
Diemsionality | Planimetric (2D or map) view |
Color Scheme | Red to Green |