
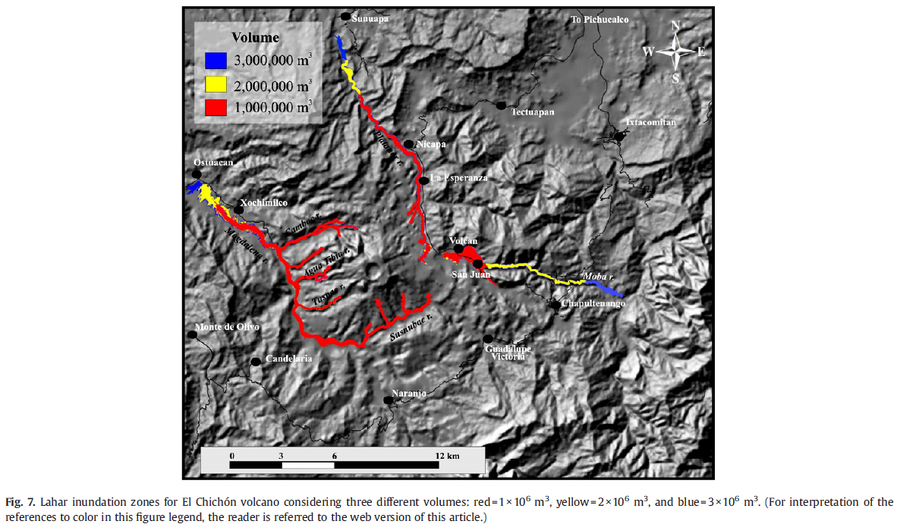
Lahar inundation zones for El Chichón volcano considering three different volumes: red=1×10^6 m3, yellow=2×10^6 m3, and blue=3×10^6 m3.
El Chichón, Mexico, 2008
Figure 7 in: Macías, J. L., Capra, L., Arce, J. L., Espíndola, J. M., García-Palomo, A., & Sheridan, M. F. (2008). Hazard map of El Chichón volcano, Chiapas, México: Constraints posed by eruptive history and computer simulations. Journal of Volcanology and Geothermal Research, 175(4), 444-458. https://doi.org/10.1016/j.jvolgeores.2008.02.023
This hazard map is the result of scientific research and was published in academic literature.
It is presented here to serve as an example of the map type or the map-making methodology. It is NOT the official, operational map. For the current operational hazard map, please consult the proper institutional authorities.
Click on thumbnail for full-size map. We do not have copyright permission to display the full-size image. If you are the copyright holder and wish to provide copyright, please contact us at admin@volcanichazardmaps.org.
Map Set
Macías, J. L., Capra, L., Arce, J. L., Espíndola, J. M., García-Palomo, A., & Sheridan, M. F. (2008). Hazard map of El Chichón volcano, Chiapas, México: Constraints posed by eruptive history and computer simulations. Journal of Volcanology and Geothermal Research, 175(4), 444-458. https://doi.org/10.1016/j.jvolgeores.2008.02.023
https://doi.org/10.1016/j.jvolgeores.2008.02.023
Other Maps In Set:
- Generalized hazard map of El Chichón volcano displayed on top of the post-1982 DEM
- TITAN2D simulations for El Chichón pyroclastic flows that display the distribution of pyroclastic flow deposits mainly along deep incised ravines
- DEM models with energy-cone extents for pyroclastic surges of El Chichón with H/L of 0.1 (A) and 0.2 (B).
- FLOW3D simulations of pyroclastic flows